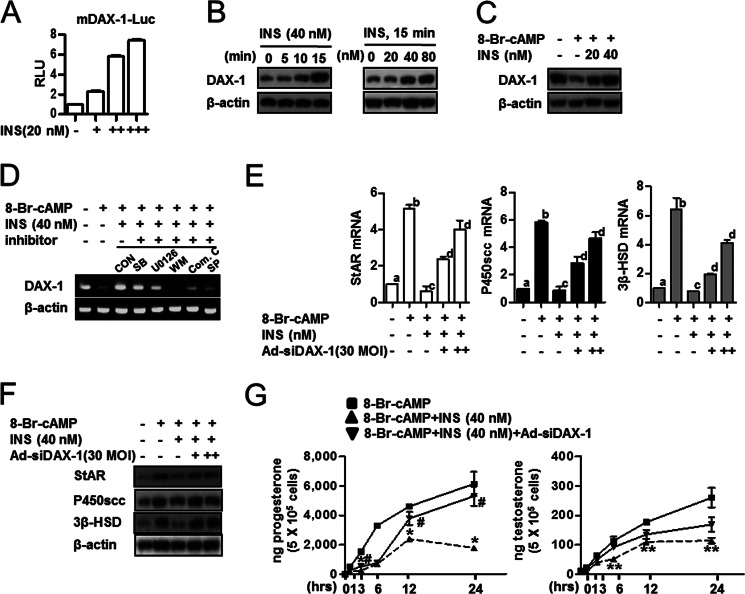
FIGURE 2.
DAX-1 is involved in insulin-mediated inhibition of steroidogenesis in Leydig cells. A, MA-10 cells were transfected with DAX-1-Luc (200 ng) and treated with insulin (INS, 20, 40, or 60 nm). MA-10 cells were treated with insulin at the indicated concentrations 24 h after transfection. B, MA-10 cells were treated with insulin (40 nm) for the indicated time period (left) or MA-10 cells were treated with insulin in a dose-dependent manner for 15 min (right) and harvested for Western blot analysis using the DAX-1 and β-actin antibodies. C, MA-10 cells were treated with 8-Br-cAMP (100 μm) and insulin (20 or 40 nm) and harvested for Western blot analysis using DAX-1 and β-actin antibodies. D, MA-10 cells were pretreated with inhibitors: SB203580 (SB, p38-MAPK inhibitor), 25 μm; U0126 (MEK1,2 inhibitor), 10 μm; wortmannin (WM, PI3K inhibitor), 0.1 μm; Compound C (Com. C, AMP-activated protein kinase inhibitor), 10 μm; SP600125 (SP, JNK inhibitor), 25 μm for 30 min and then treated with 8-Br-cAMP (100 μm) or 8-Br-cAMP (100 μm) + insulin (40 nm). Control (CON) cells were treated only with DMSO. Total RNA was isolated for semiquantitative reverse transcription-polymerase chain reaction (RT-PCR) analysis. E, MA-10 cells were infected with Ad-siDAX-1 (30 or 60 MOI) and treated with 8-Br-cAMP (100 μm) or 8-Br-cAMP (100 μm) + insulin (40 nm). Total RNA was isolated for real-time PCR analysis. Each data point represents the mean ± S.E. Bars with different letters in this panel indicate statistically significant differences in mean values from each other (p < 0.05), as determined by ANOVA and Student-Newman-Keuls test. F, MA-10 cells were infected with Ad-siDAX-1 (30 or 60 MOI) and treated with 8-Br-cAMP (100 μm) or 8-Br-cAMP (100 μm) + insulin (40 nm). MA-10 cells were harvested for Western blot analysis using StAR, P450scc, 3β-HSD, and β-actin antibodies. G, MA-10 cells were treated with 8-Br-cAMP (100 μm), insulin (40 nm), or insulin with Ad-siDAX-1 (30 MOI) for the indicated time period, and medium was collected for progesterone (left) and testosterone (right) measurement by radioimmunoassay. Each data point represents the mean ± S.E. *, p < 0.05, significantly different from 8-Br-cAMP group by the Newman-Keuls test; #, p < 0.05, significantly different from 8-Br-cAMP + insulin group by the Newman-Keuls test; **, p < 0.05, significantly different from 8-Br-cAMP group by the Newman-Keuls test.

