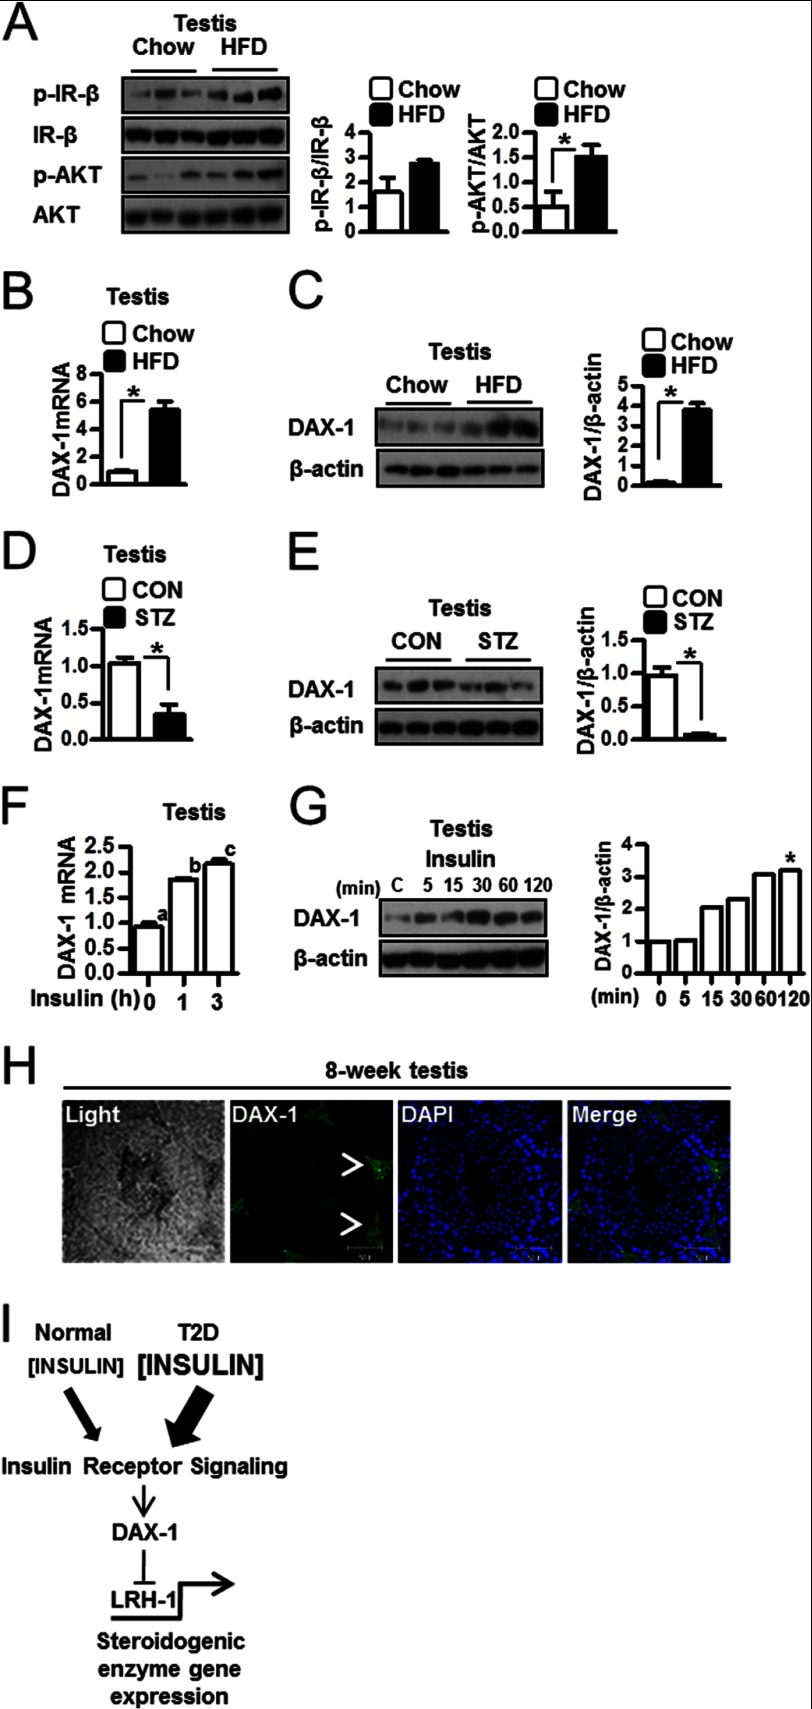
FIGURE 6.
Induction of DAX-1 in testis. A, testes of HFD-fed mice were prepared for Western blot assay. Samples were extracted, and Western blot analyses were performed using the phospho-IR-β (p-IR-β), IR-β, phospho-AKT (p-AKT), and AKT antibodies. Each data point represents the mean ± S.E. *, p < 0.05, significantly different from chow group by two-tailed t test. B, total RNA was isolated for real-time PCR from chow diet-fed and HFD-fed mice testes (n = 3). DAX-1 mRNA level is measured in testis. Each data point represents the mean ± S.E. *, p < 0.05, significantly different from chow group by two-tailed t test. C, protein samples were prepared for Western blot assay from chow diet-fed and HFD-fed mice testes (n = 3). DAX-1 protein level was measured in testis. Each data point represents the mean ± S.E. *, p < 0.05, significantly different from chow group by two-tailed t test. D, total RNA was isolated for real-time PCR from chow and streptozotocin (STZ) mice testes (n = 3). DAX-1 mRNA level was measured in testis. Each data point represents the mean ± S.E. *, p < 0.05, significantly different from control (CON) group by two-tailed t test. E, protein samples were prepared for Western blot assay from control and streptozotocin mice testes (n = 3). DAX-1 protein level was measured in testis. Each data point represents the mean ± S.E. *, p < 0.05, significantly different from control group by two-tailed t test. F, total RNA was isolated for real-time PCR from insulin-injected 8-week-old mouse testes (n = 5). DAX-1 expression was measured at the indicated time. Each data point represents the mean ± S.E. Bars with different letters in this panel indicate statistically significant differences in mean values from each other (p < 0.05), as determined by ANOVA and Student-Newman-Keuls test. G, 8-week-old C57BL/6J mice were injected insulin (1 unit/kg). Testes of C57BL/6J mice were prepared for Western blot assay (n = 3). Samples were extracted, and Western blot analyses were performed using the DAX-1 and β-actin antibodies. * indicates the highest DAX-1 protein level. H, testes were collected from 8-week-old C57BL/6J mice for immunohistochemistry. Expression of DAX-1 was only observed in the Leydig cells of the testis. The arrowheads show the DAX-1 stain in 8-week testis. I, proposed mechanism for the importance of regulation of steroidogenesis by insulin. Insulin induces DAX-1 gene expression, and DAX-1 regulates LRH-1-mediated steroidogenic enzyme gene expression and steroidogenesis in testis. The low level of insulin in individuals with normal insulin sensitivity mildly opposes the stimulation of steroidogenesis by LH. However, greater up-regulation of DAX-1 by insulin is observed in individual with insulin resistance, and therefore, high insulin level inhibits testicular steroidogenesis in the T2D diabetes model.

