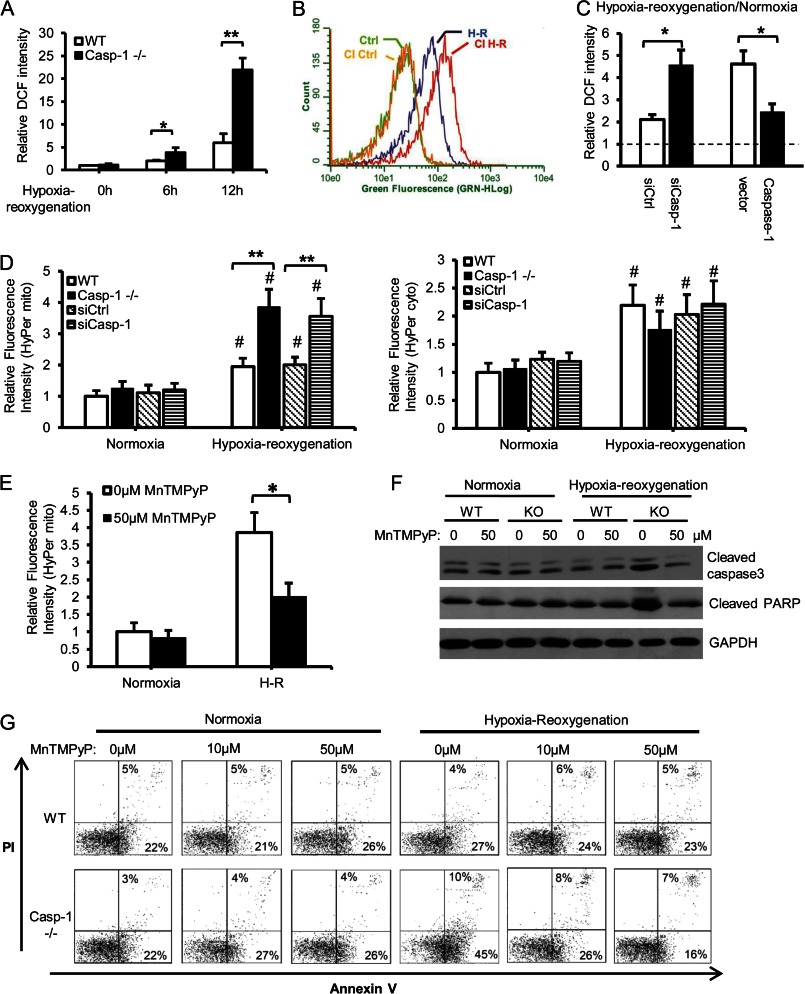
FIGURE 2.
Caspase 1 deficiency increases mitochondrial ROS production during hypoxia/reoxygenation. A, intracellular ROS estimated by DCF staining in hepatocytes after normoxia or hypoxia for 6 or 12 h and 1 h of reoxygenation. Fluorescence intensity was quantified and normalized to normoxic WT levels. Data are mean ± S.E. *, p < 0.05; **, p < 0.01. B, DCF fluorescence measured by flow cytometry in WT hepatocytes pretreated with vehicle (dimethyl sulfoxide) or caspase 1 inhibitor (CI) and then 6 h of hypoxia/1 h of reoxygenation (H-R). Data shown are representative histograms from two independent experiments. C, relative intracellular ROS estimated by DCF staining in WT hepatocytes treated with caspase 1 siRNA and caspase 1−/− cells expressing mouse caspase 1 after normoxia or 6 h of hypoxia/1 h of reoxygenation. Data are shown as fold changes of normoxic levels (mean ± S.D., n = 3). *, p < 0.05. D, mitochondrial (left panel) and cytoplasmic H2O2 (right panel) in hepatocytes treated with 6 h of hypoxia/1 h of reoxygenation. Data are mean ± S.E. #, p < 0.05, hypoxia-reoxygenation versus normoxia; **, p < 0.01, WT versus caspase 1−/− or siCtrl versus siCasp-1. E, mitochondrial H2O2 in caspase 1−/− hepatocytes pretreated with 50 μm MnTMPyP for 1 h before they were subjected to 6 h of hypoxia/1 h of reoxygenation. Data are mean ± S.E., n = 3. *, p < 0.05. F, representative Western blot analysis of cleaved caspase 3 and PARP in hepatocytes pretreated with 50 μm MnTMPyP for 1 h before they were subjected to 6 h of hypoxia/1 h of reoxygenation. G, annexin V/PI staining in WT and caspase 1−/− hepatocytes pretreated with 0, 10, or 50 μm MnTMPyP for 1 h and subjected to 6 h of hypoxia/1 h of reoxygenation or normoxia. Data are representative of two independent experiments.

