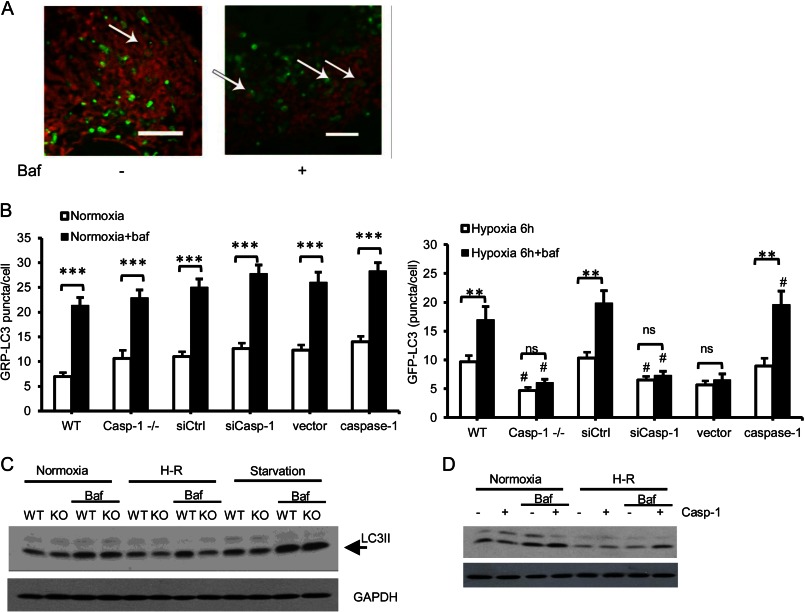
FIGURE 4.
Caspase 1 regulates autophagic flux in hepatocytes after oxidative stress. A, mitochondria (MitoTracker Red) contained autophagosomes (GFP-LC3) in WT hepatocytes after 6 h of hypoxia/1 h of reoxygenation ± bafilomycin (Baf) (50 nm). Images are representative of at least three separate experiments. Scale bar = 10 μm. B, quantification of autophagosomes (GFP-LC3 puncta) in hepatocytes after 6 h of hypoxia/1 h of reoxygenation ± bafilomycin (50 nm). Data are mean ± S.E. **, p < 0.01; ***, p < 0.001, steady state versus bafilomycin treatment; #, p < 0.05, WT versus caspase 1−/−, siCtrl versus siCasp-1 or vector versus caspase 1; ns, not significant. C, the expression of LC3 in WT and caspase 1−/− hepatocytes left untreated, treated with 6 h of hypoxia/1 of h reoxygenation (H-R), or starvation ± bafilomycin (50 nm). D, the expression of LC3 in caspase 1−/− hepatocytes and caspase 1 reconstituted cells cultured under normoxia or treated with 6 h of hypoxia/1 h of reoxygenation ± bafilomycin (50 nm).

