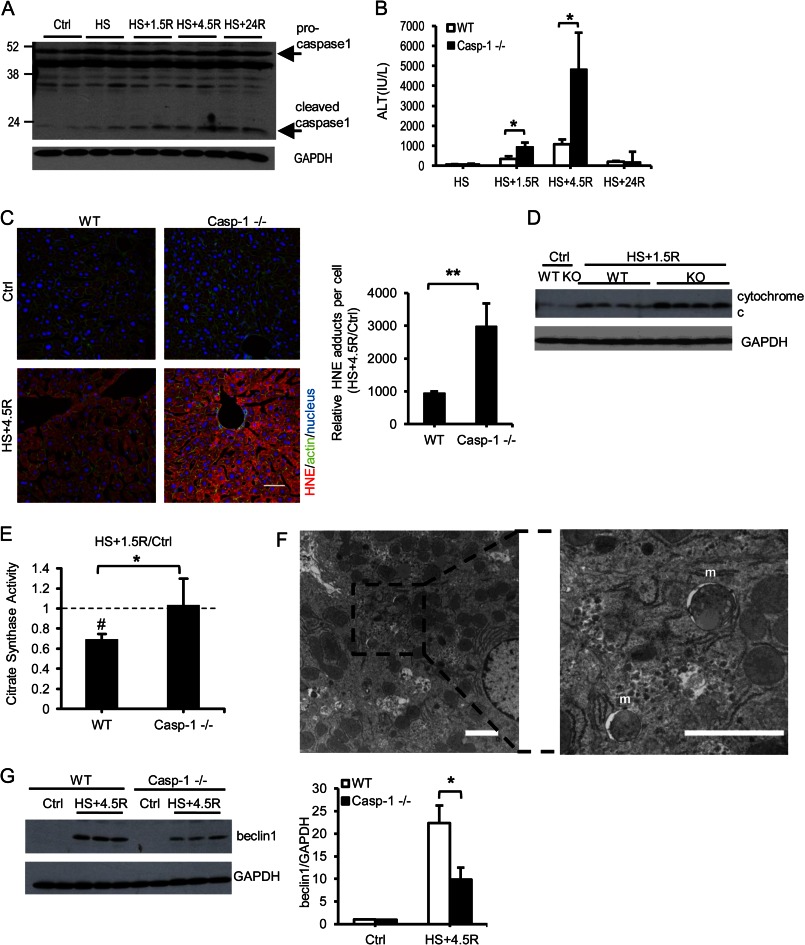
FIGURE 6.
Caspase 1 activation reduced liver injury and oxidative stress after HS/R. A, representative Western blot of caspase 1 in liver of WT mice after HS/R. B, plasma alanine aminotransferase (ALT) in mice after HS/R (n = 5 in control groups, n = 7–8 in HS/R groups). Data are mean ± S.E. *, p < 0.05. C, representative staining. Scale bar = 100 μm and quantification of 4-hydroxy-2-nonenal adducts in liver of control mice (Ctrl) and mice subjected to hemorrhagic shock and 4.5 h of resuscitation (HS+4.5R). Data are mean ± S.E., n = 3 for control and n = 5 for HS+4.5R. **, p < 0.01. Quantification is shown as fold increase to control groups. D, cytochrome c release was determined by Western blot analysis of liver cytosolic fraction. E, mitochondrial content in liver was determined by citrate synthase activity and normalized to controls. Data are mean ± S.E., n = 4. #, p < 0.05, HS+1.5R versus control; *, p < 0.05, WT versus caspase 1−/−. F, electron microscopy images of WT liver treated with hemorrhagic shock and 4.5 h of resuscitation. m, mitochondria-containing autophagosomes. Scale bar = 2 μm. G, Western blot analysis and quantification of beclin 1 levels in livers of control mice or mice subjected to HS+4.5R. Data are mean ± S.D., n = 3 for control groups and n = 6 for HS+4.5R groups. *, p < 0.05.

