
FIGURE 3.
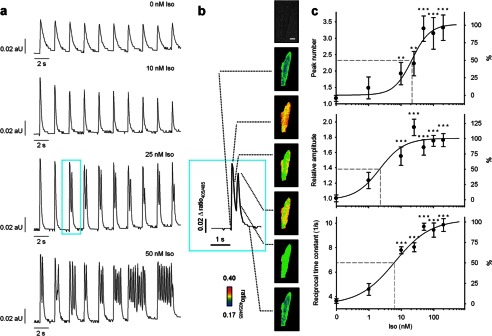
Spontaneous diastolic Ca2+ transients induced by Iso. Cardiac myocytes were loaded with indo-1/AM, and Ca2+ imaging was carried out as described under “Experimental Procedures.” Iso was added 5 min before recording of transients. a, characteristic trains of transients obtained at 0.5 s−1 electrical pacing are shown. aU, arbitrary units. b, enlargement of the Ca2+ transient from a is shown. The respective cell is shown in bright field. Pseudo-color images represent different time points as indicated (dotted lines). The number of Ca2+ transients per electrical stimulation, Ca2+ transient amplitude, and the reciprocal time constants were analyzed as a function of Iso concentration (c); data are presented as mean ± S.E. (n = 12–31). Significant differences to controls are indicated by **, p < 0.01, or ***, p < 0.001. An ANOVA model followed by LSD post hoc tests was applied to investigate the effect of different concentrations of Iso on Ca2+ transient amplitude and reciprocal time constant. A Mann-Whitney rank sum test was applied to investigate the effect of different concentrations of Iso on peak number.