FIGURE 2.
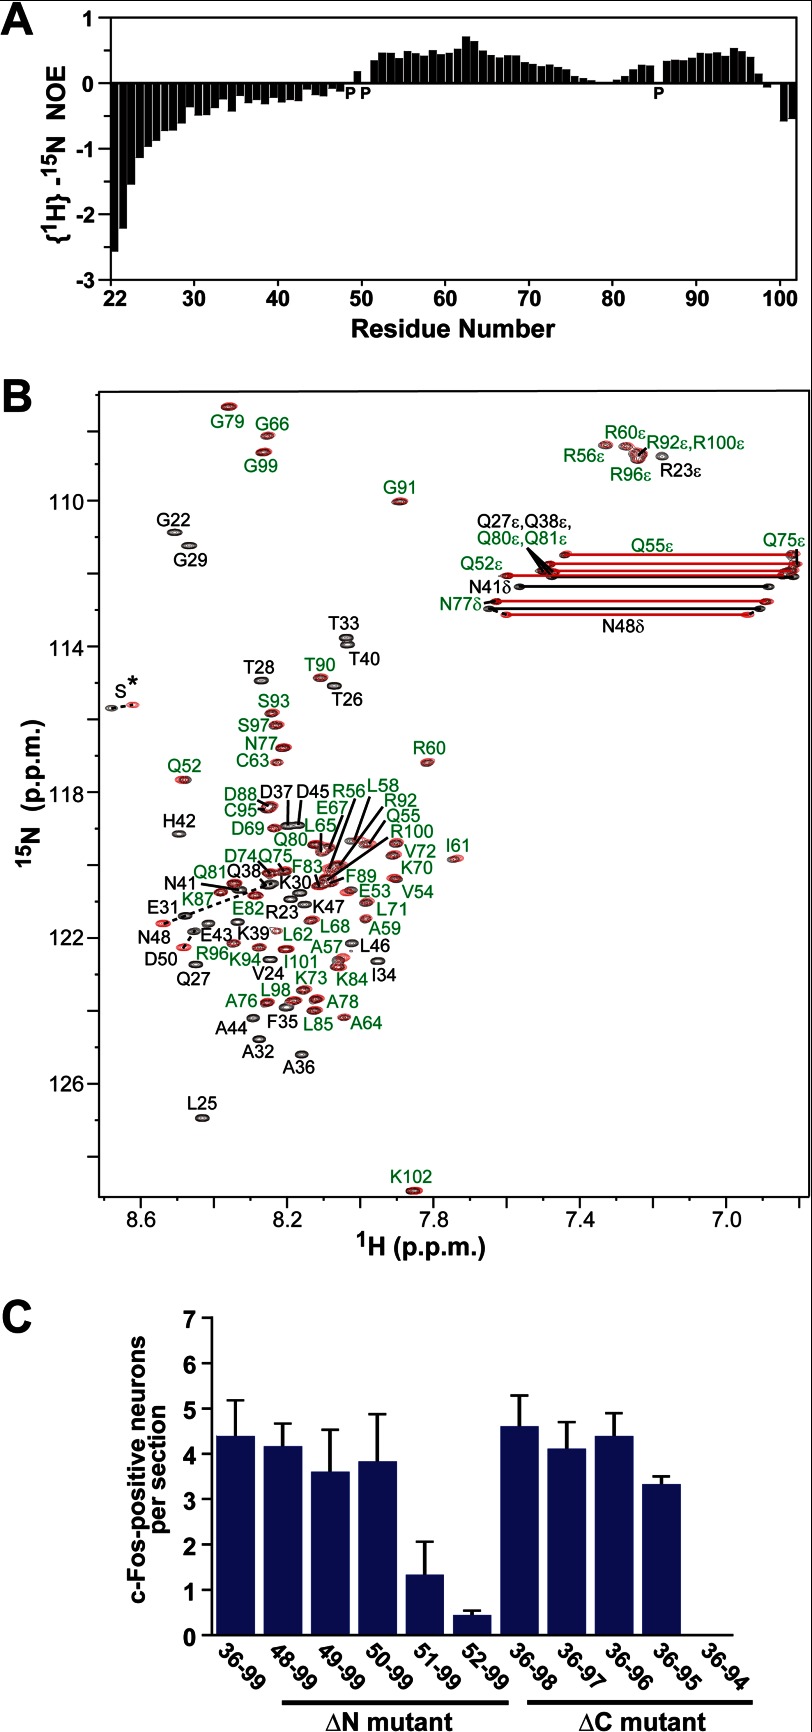
Identification of the structural and functional regions of ESP1. A, analysis of the backbone mobility of ESP1(22–102) using {1H}–15N NOE. Histogram shows the {1H}–15N heteronuclear NOE data obtained for the backbone 15N nuclei of ESP1(22–102) as a function of residue number. Proline residues are indicated as P. B, comparison of the 1H–15N HSQC spectra of ESP1(22–102) and ESP1(48–102). The 1H–15N HSQC spectra of ESP1(22–102) (black) and ESP1(48–102) (red) are overlaid. Overlapping NMR signals derived from the same ESP1(22–102) and ESP1(48–102) residues are labeled in green, whereas the remaining signals are shown with black residue labels. Nonoverlapping signals from the same ESP1(22–102) and ESP1(48–102) residues are represented by dashed lines between the two peaks. The serine signals derived from the thrombin cleavage site on the N-terminal side of ESP1 are indicated as S*. C, analysis of the c-Fos-inducing activity of the ESP1 deletion mutants. The number of c-Fos-positive VNO neurons was counted in BALB/c female mice stimulated with ESP1(36–99), the N-terminal deletion mutant (ΔN mutant), or the C-terminal deletion mutant (ΔC mutant). The average values were obtained from slice sections of the mouse VNO (n = 6 slices, n = 3 mice).

