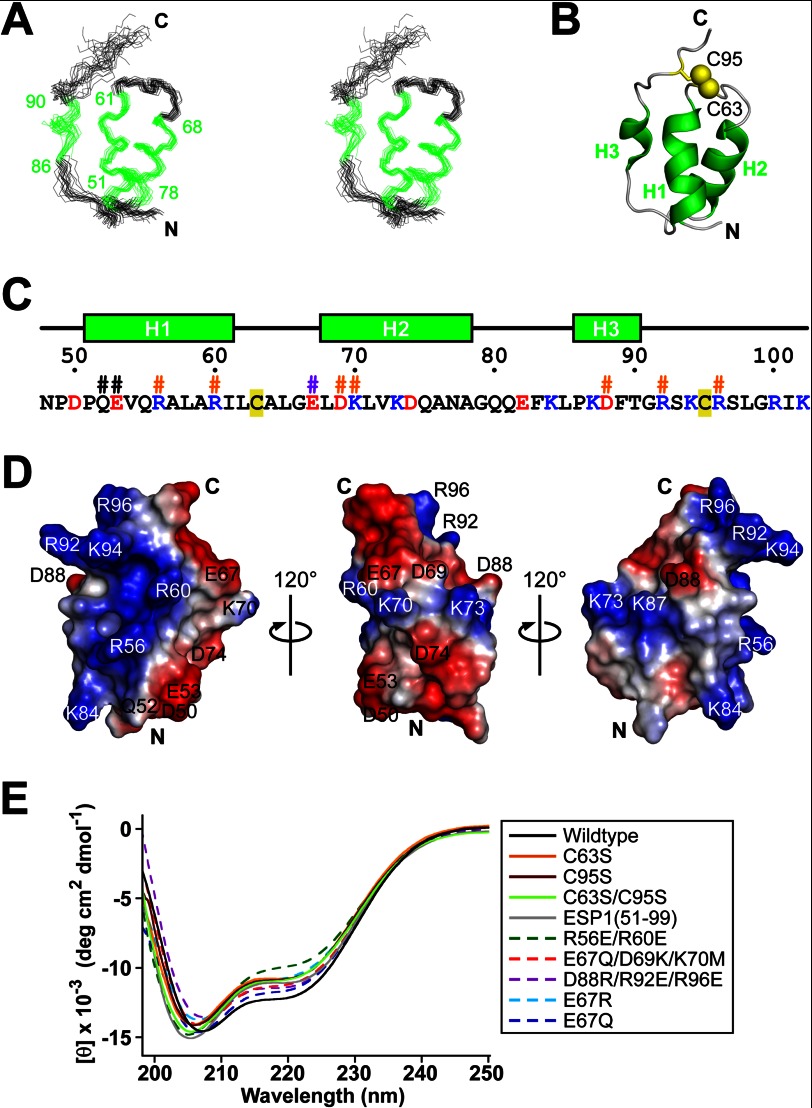
FIGURE 3.
Structure of the core domain of ESP1. A, stereo pair representation of the 20 NMR structures of ESP1(48–102) with the lowest CYANA target function superimposed on the helical regions (green). The residue numbers of helix termini are indicated. B, ribbon representation of the ESP1(48–102) structure. Each helix is labeled as H1, H2, or H3 and is colored green. The N and C termini are marked with N and C, respectively. Disulfide bridges are depicted by yellow balls and sticks, and the cysteine residue numbers are indicated. The view of the structure is the same as in A. C, amino acid sequence of ESP1(48–102). The secondary structure and the numbers of ESP1 residues are shown above the sequence. Positively and negatively charged residues are colored blue and red, respectively. Cysteine residues are tinted yellow. The mutated residues for the c-Fos induction assay are marked with #, with the same color scheme as in Fig. 4E. D, electrostatic potentials on the molecular surface of ESP1(48–102). Positive and negative surface potentials are represented in blue and red, respectively. The numbers of charged residues are indicated. The structure on the left is represented from the same viewpoint as A. The three views are related by 120° rotations around the vertical axis. E, superposition of the far-UV CD spectra of ESP1 and its mutants, using the same color scheme and line style as in the right panel.

