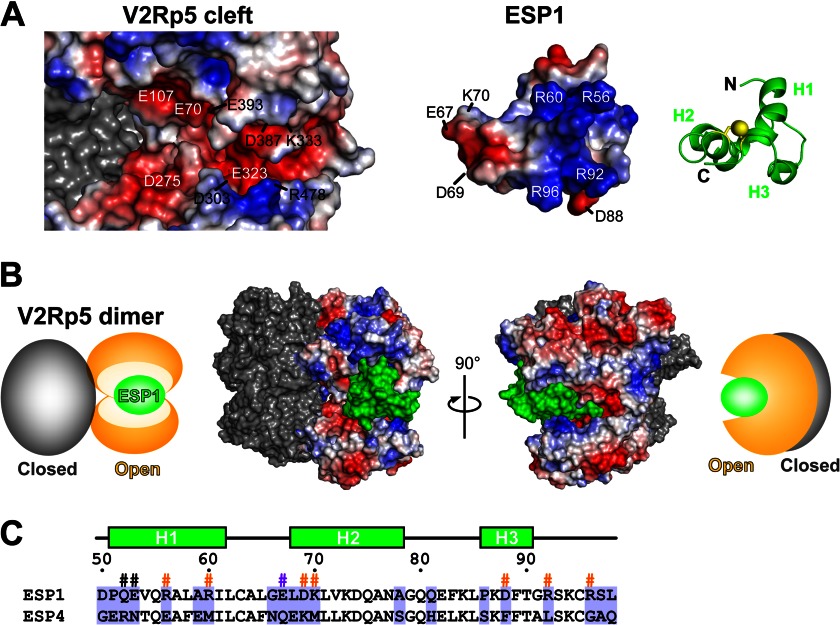
FIGURE 6.
Structural model of the ESP1-V2Rp5 complex. A, putative binding surface of a docking model of ESP1 and the extracellular region of V2Rp5, shown as an open-book representation. The positive and negative surface potentials of the open subunit of V2Rp5 (left) and ESP1 (middle) are colored blue and red, respectively. The molecular surface of the closed subunit of V2Rp5 (left) is colored gray. ESP1, represented by the green ribbon model on the right, is shown from the same viewpoint as the electrostatic surface model in the middle, corresponding to a 40° rotation about the horizontal axis and a 180° rotation in-plane of the view in Fig. 3B. B, binding model of the ESP1-V2Rp5 complex. The molecular surface model of the ESP1-V2Rp5 complex is shown together with its schematic diagram. The view on the right is a 90° rotation about the vertical axis of the view on the left. The positive and negative surface potentials of the open subunit of V2Rp5 are colored blue and red. The molecular surfaces of ESP1 and the closed subunit of V2Rp5 are colored green and gray. In the schematic diagram, the open and closed subunits of V2Rp5 and ESP1 are colored orange, gray, and green, respectively. C, sequence alignment of ESP1 and ESP4. The sequence alignment corresponding to the core domain of ESP1 is shown for ESP1 and ESP4. Residues that are not type-conserved are tinted light purple. The secondary structure and the numbers of ESP1 residues are shown above the sequence. The ESP1 residues mutated for the c-Fos induction assay in Fig. 4 are marked with #, with the same color scheme as in Fig. 4E.

