FIGURE 1.
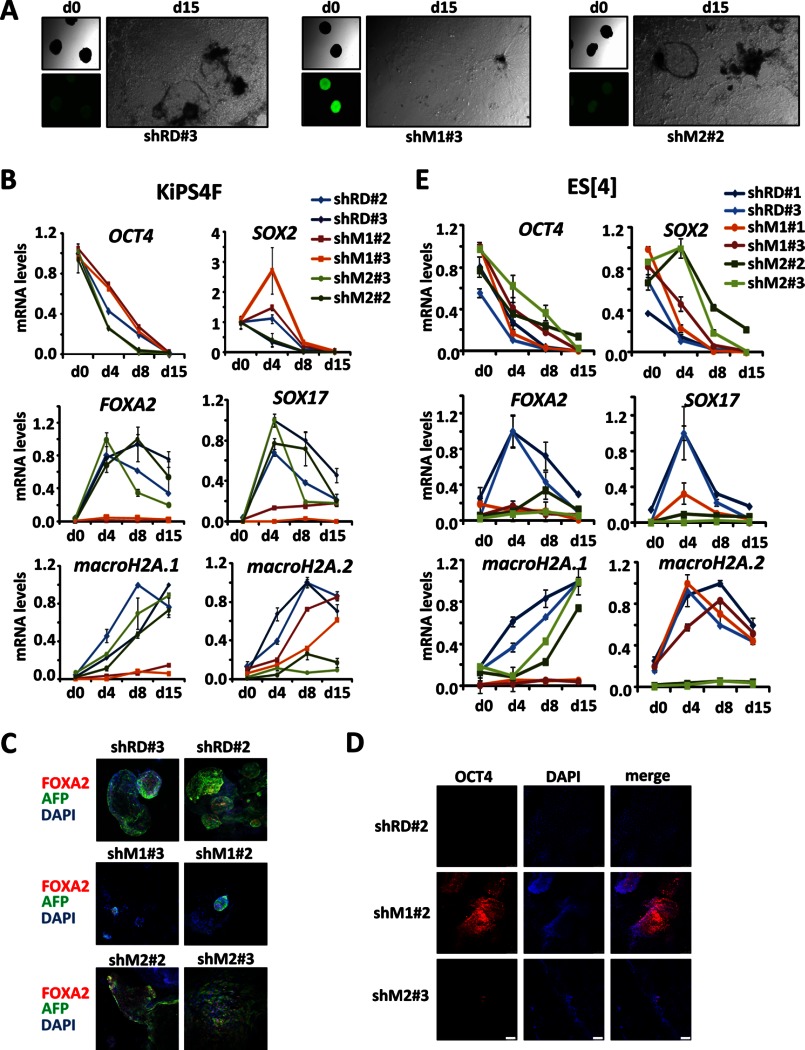
Effects of macroH2A.1 and macroH2A.2 knockdown in the differentiation of human pluripotent cell lines. A, phase contrast and fluorescence images of EBs obtained from KiPSCs control (shRD), knockdown for macroH2A.1 (shM1), and macroH2A.2 (shM2) at days 0 and 15 of differentiation. B, mRNA levels determined by qPCR of pluripotency and differentiation genes during the differentiation of two clones each of control KiPS (shRD) and KiPSCs knocked down for macroH2A.1 (shM1) or macroH2A.2 (shM2). mRNA levels were normalized to GAPDH and plotted relatively to day 0 (d0) for pluripotency markers and relatively to the maximum expression level for differentiation genes. Each clone was tested in two independent differentiation experiments with similar results. Graphs show the mean ± S.D. (error bars) of triplicates of one representative and independent differentiation experiment per clone. C, immunocytochemical analysis of the expression of the endodermal genes FOXA2 (red) and AFP (green) in two clones each of control KiPSCs (shRD) and KiPSCs knocked down for macroH2A.1 (shM1) or macroH2A.2 (shM2) at day 20 of EB differentiation. D, OCT4 immunodetection in EBs obtained from one clone each of control KiPSCs (shRD), knocked down for macroH2A.1 (shM1) or macroH2A.2 (shM2) at 15 days of differentiation. E, mRNA levels determined by qPCR of pluripotency and differentiation genes during the differentiation of two clones each of ES[4] control (shRD) ES[4], knockdown for macroH2A.1 (shM1) or macroH2A.2 (shM2). mRNA levels were normalized to GAPDH and plotted relative to the maximum expression level. Graphs show the mean ± S.D. (error bars) of triplicates.

