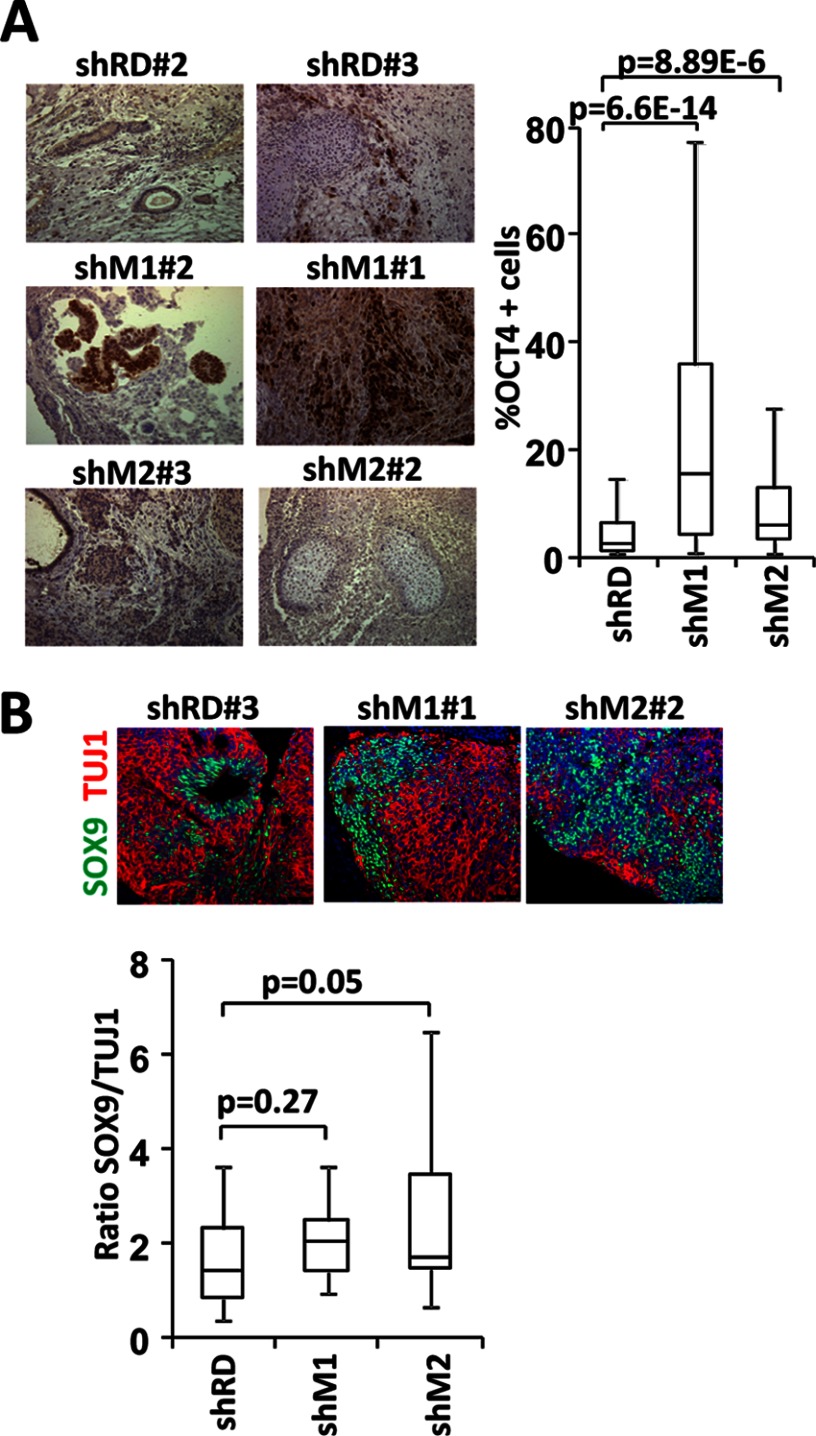
FIGURE 2.
Characterization of teratomas. A, levels of OCT4 expression were determined by immunohistochemistry in teratomas from two lines each of control KiPSCs (shRD) and KiPSCs knocked down for macroH2A.1 (shM1) or macroH2A.2 (shM2). The left panel shows one representative picture of OCT4 immunostaining per line, visualized using DAB (brown) over hematoxylin (blue). The right panel shows a box plot representation of the percentage of OCT4-positive cells found in teratomas from both lines of shRD, shM1 and shM2. B, upper panel shows a representative picture of neural rosettes in teratomas from control and macroH2A.1 or macroH2A.2 knocked down KiPSCs, showing SOX9 (green) and TUJ1 (red) immunolocalization. Lower panel shows a box plot representation of the relative ratio of Sox9- to Tuj1-expressing cells in neuronal rosettes detected by immunohistochemistry.

