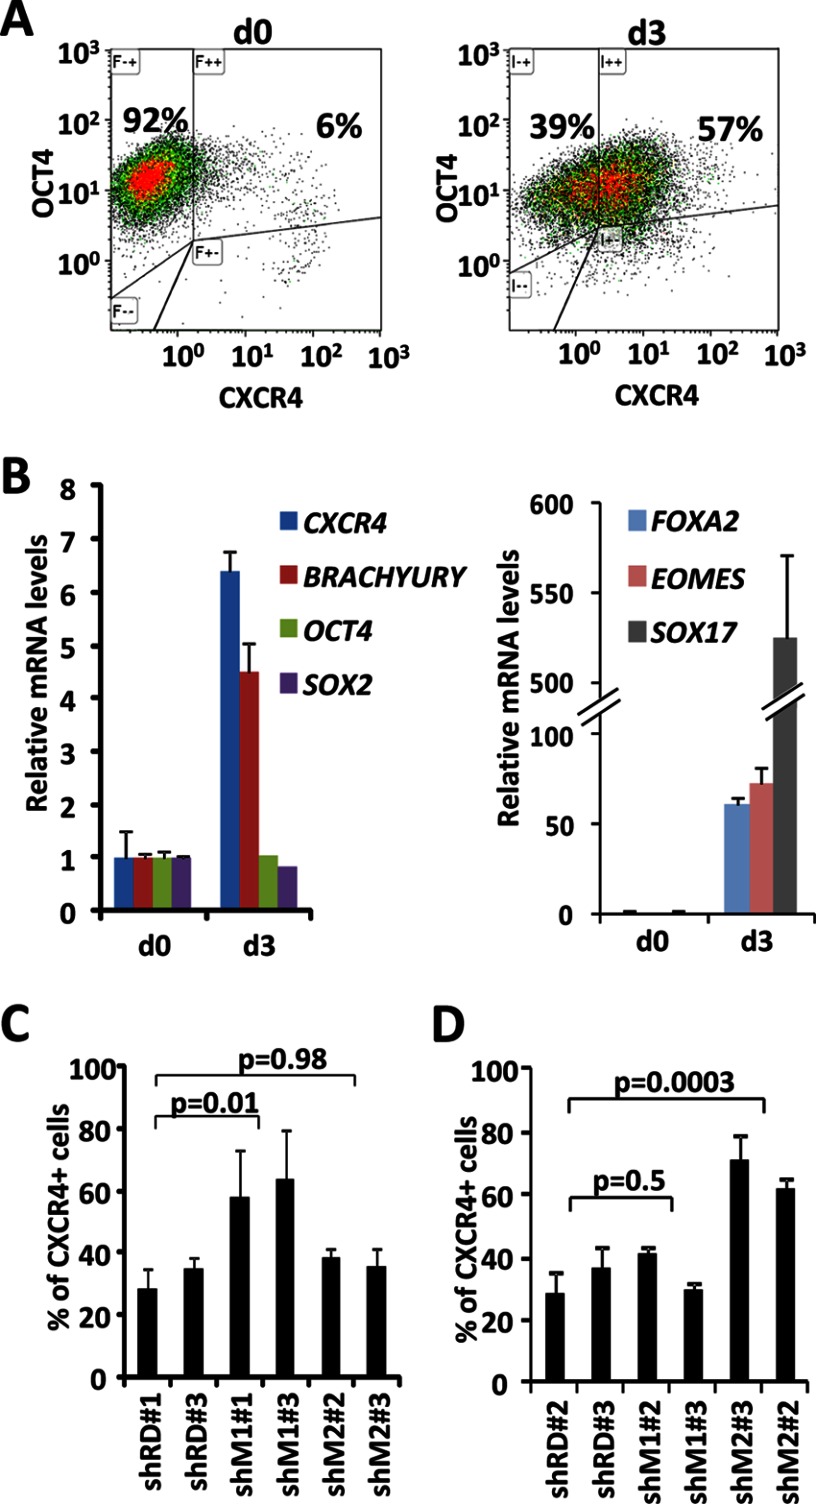
FIGURE 3.
Activin A activates target genes in pluripotent lines knocked down for macro histone variants. A, FACS analysis of expression of OCT4 and CXCR4 in ESCs before (day 0) and after 3 days (day 3) of treatment with Activin A. B, mRNA levels determined by qPCR of pluripotency and differentiation genes in ESCs before (d0) and after 3 days (d3) of Activin A treatment. mRNA levels were normalized to GAPDH. Graphs show the mean ± S.D. (error bars) of triplicates. C, FACS analysis of the percentage of cells that express CXCR4 after 3 days of Activin A treatment in two lines of ES[4] control (shRD), knocked down for macroH2A.1 (shM1) or for macroH2A.2 (shM2). Graphs show the mean ± S.D. of at least four independent treatments. D, FACS analysis of the percentage of cells that express CXCR4 after 3 days of Activin A treatment in two lines of KiPS control (shRD), knocked down for macroH2A.1 (shM1) or for macroH2A.2 (shM2). Graphs show the mean ± S.D. of at least four independent treatments.

