FIGURE 1.
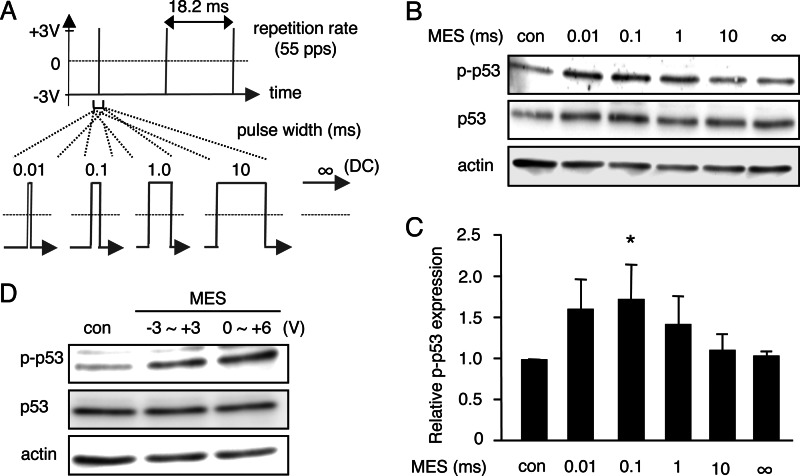
MES at a pulse width of 0.1 ms induces phosphorylation of p53. A, pulse shape with the indicated pulse width in milliseconds of the electrical stimulation used for treatment. DC, direct current. B, HCT116 cells were treated for 10 min with MES (1 V/cm, 55 pps) at various pulse widths (0.01, 0.1, 1, and 10 ms) or in the absence of pulse (∞ ms). Cell lysates were extracted 1 h after MES treatment. Phospho-p53 (Ser-15; p-p53) and p53 were detected by Western blot analysis. Actin served as a loading control. con, control. C, blots of phospho-p53 were quantified by densitometry using Image Gauge software (version 4.23, Fujifilm). Quantified blots were normalized to actin and are expressed as -fold increase relative to the control. Error bars indicate the mean ± S.D. (n = 3). *, p < 0.05 (assessed by analysis of variance with Dunnett's multiple comparison test). D, cells were treated for 30 min with MES (0.1 ms) at an amplitude of 6 V with a reference voltage (V0) at −3 or 0 V, and lysates were recovered 1 h after treatment. Cell lysates were analyzed by immunoblotting with the indicated antibodies. Actin served as an internal control.

