
Figure 1.
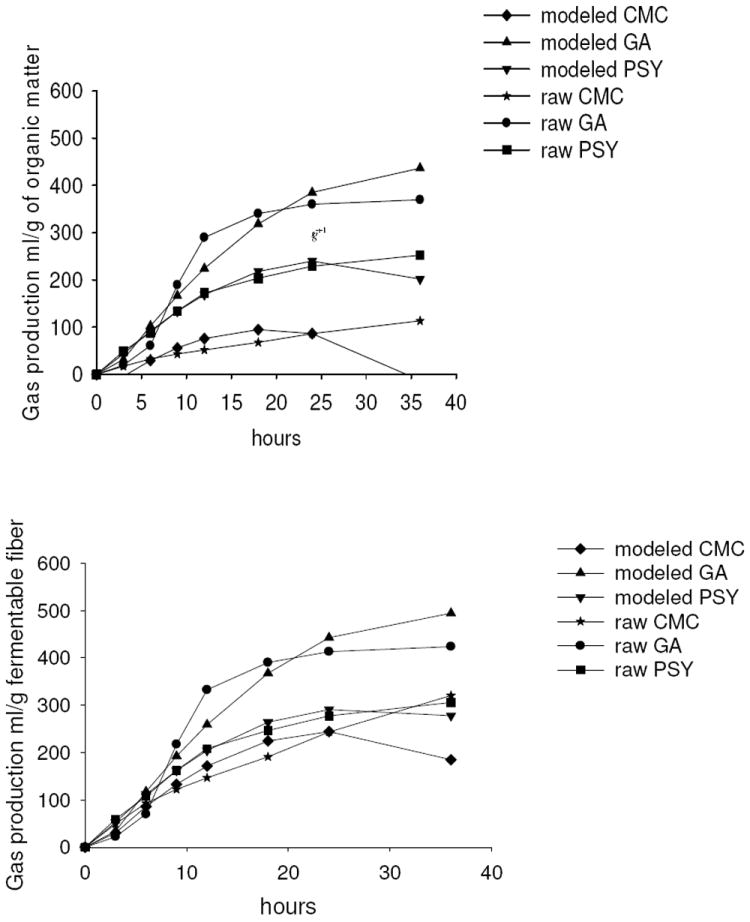
Graphs show raw and modeled data of gas production over time calculated per g of total organic matter of the fibers (Figure 1a) and measured dietary fiber content of the fiber sources (Figure 1b).
Official websites use .gov
A
.gov website belongs to an official
government organization in the United States.
Secure .gov websites use HTTPS
A lock (
) or https:// means you've safely
connected to the .gov website. Share sensitive
information only on official, secure websites.
Graphs show raw and modeled data of gas production over time calculated per g of total organic matter of the fibers (Figure 1a) and measured dietary fiber content of the fiber sources (Figure 1b).