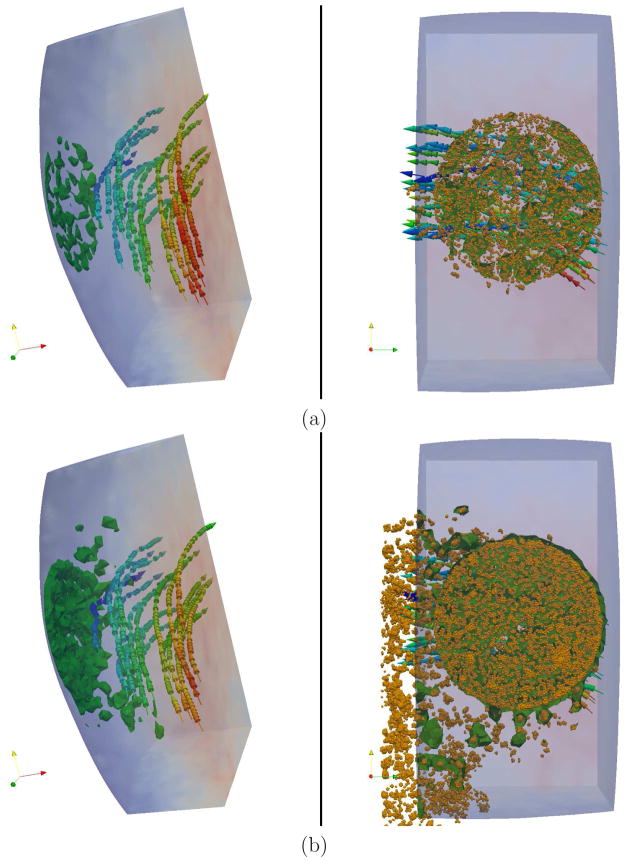
Figure 12.
Brain vasculature: coupled continuum-atomistic simulation of platelet deposition at the wall of an aneurysm with Re = 394 and Ws = 3.75. Left - side view; right - bottom view. Yellow dots - active platelets; streamlines with arrows depict the flow direction; colors correspond to the velocity magnitude. (a) - onset and (b) advanced stage of clot growth.

