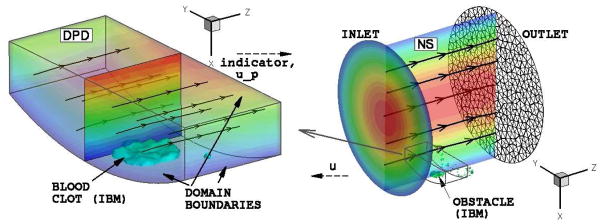
Figure 9.

Pipe flow: coupled continuum-atomistic simulation with Re = 350. A clot is formed by platelet aggregation at the wall of a pipe. Left - atomistic modeling. Streamlines show the flow direction; colors show the stream-wise velocity component magnitude; iso-surface corresponds to the active platelet density 1.75 times larger than the bulk normal density. Right - continuum modeling. Streamlines show the flow direction; colors show the stream-wise velocity component magnitude; obstacle is shown by plotting an iso-surface of indicator function φ = 0.5.
