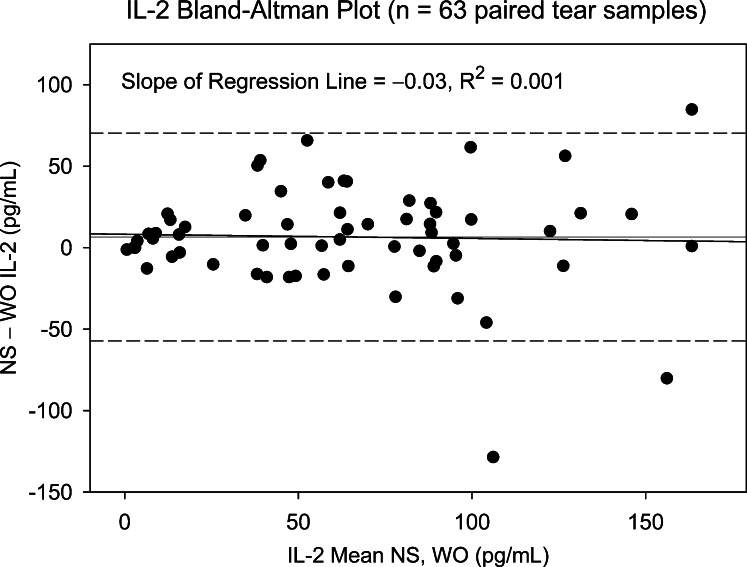
Figure 3. .
Bland–Altman plot showing difference between NS and WO tear IL-2 level versus mean level for paired tear samples (entire patient group). Slope of the regression plot is negligible, indicating that the difference between NS and WO levels does not vary as a function of the mean. Dashed lines represent 95% confidence limits. Three data points fall outside the Bland–Altman range for agreement between tests.

