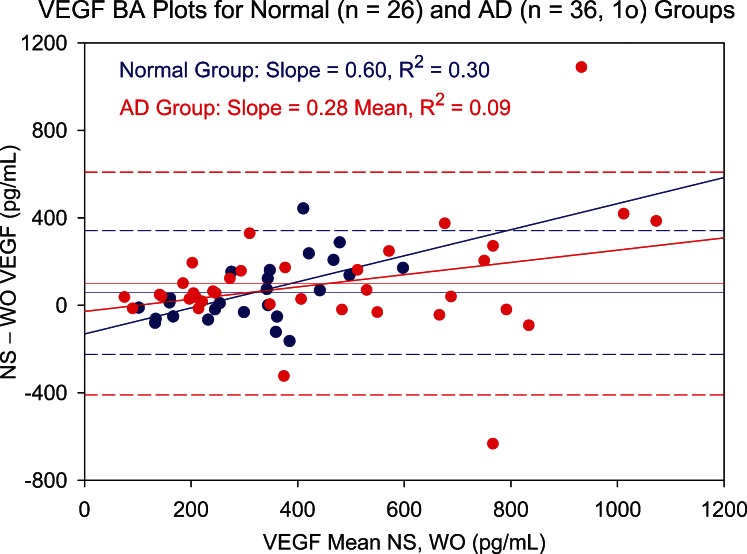
Figure 6. .
Bland–Altman (BA) plot showing NS versus WO tear levels of VEGF for normal (blue circles) and aqueous-deficient (AD, red circles) patient groups. Difference between NS and WO tear VEGF levels is plotted against mean level for paired tear samples. Slope of the BA plot is positive for both groups. Both groups show increased scatter with increasing mean VEGF level, but the effect is more pronounced for the AD group. Dashed lines represent 95% confidence limits. 1o, one outlier.

