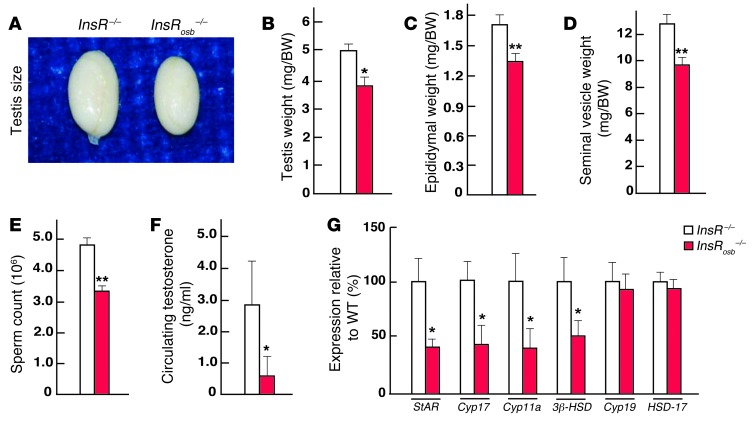
Figure 5. Insulin signaling in osteoblasts favors testosterone production.
(A) Testis size, and (B) testis, (C) epididymal, and (D) seminal vesicle weights normalized to BW (mg/g of BW); (E) sperm count; (F) circulating testosterone levels in InsRosb–/– versus WT male mice. (G) qPCR analysis of the expression of StAR, Cyp11a, Cyp17, 3β-HSD, Cyp19, and HSD-17 genes in testes of InsRosb–/– (n = 10) and WT (n = 12) mice. All analyses presented were performed on nonbreeder mix background (129/Sv: 87.5%; 129/Sv: 12.5%) mice. *P < 0.05; **P < 0.01.

