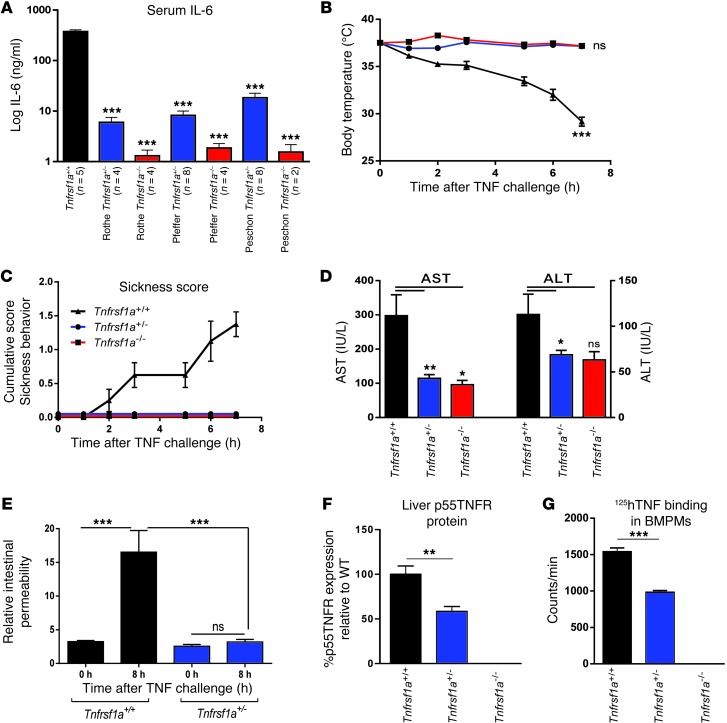
Figure 1. Resistance of Tnfrsf1a+/– mice to TNF-induced lethal inflammation.
(A) Serum IL-6 6 hours after a single i.p. injection of 100 μg TNF in the Rothe (12), Pfeffer (14), and Peschon (13) Tnfrsf1a-deficient mouse lines. ***P < 0.001, compared with Tnfrsf1a+/+. (B) Body temperature (***P < 0.001, compared with Tnfrsf1a+/– and Tnfrsf1a–/–), (C) sickness score, (D) serum AST and ALT levels, and (E) intestinal permeability of Tnfrsf1a+/+, Tnfrsf1a+/–, and Tnfrsf1a–/– mice after i.p injection with 50 μg TNF i.p. (or 25 μg i.p. for permeability assay) (n = 8 for all groups). (F) p55TNFR expression, measured by ELISA, in liver samples. (G) Specific binding of 125I-hTNF to BMDMs. In D and F, levels in Tnfrsf1a–/– and Tnfrsf1a+/– were 0, so no statistical significance could be calculated toward Tnfrsf1a+/+ data. Data represent mean ± SEM. *P < 0.05, **P < 0.01, ***P < 0.001 (Student’s t test).

