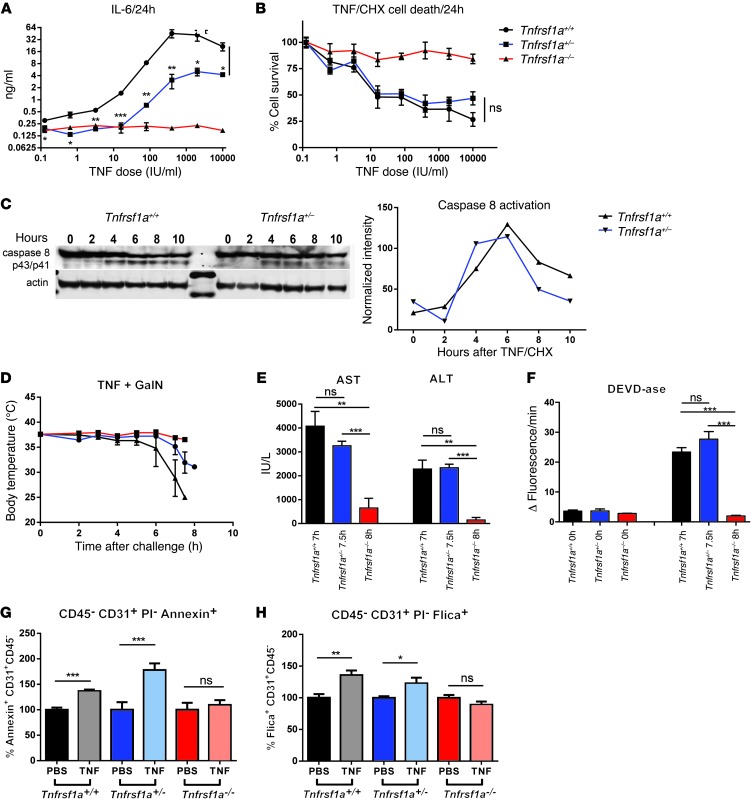
Figure 5. Induction of apoptosis in Tnfrsf1a+/– mice.
(A) IL-6 production in supernatant of Tnfrsf1a+/+, Tnfrsf1a+/–, and Tnfrsf1a–/– fibroblasts (n = 4) 24 hours after TNF stimulation. (B) Measurement of Tnfrsf1a+/+, Tnfrsf1a+/–, and Tnfrsf1a–/– fibroblast survival after stimulation with different concentrations of TNF/CHX (10 μg/ml). Both Tnfrsf1a+/+ and Tnfrsf1a+/– cells undergo apoptosis to a similar extent. (C) Caspase-8 Western blot after TNF/CHX stimulation (1,000 IU/ml and 10 μg/ml) at different time points. The intensity of cleaved caspase-8 (p43/p41) bands was normalized to actin levels. (D) Body temperature of Tnfrsf1a+/+ (n = 4), Tnfrsf1a+/– (n = 5), and Tnfrsf1a–/– (n = 3) mice after i.p. injection with 1 μg TNF plus 20 mg GalN. Tnfrsf1a+/+ and Tnfrsf1a+/– mice were euthanized for sampling when their body temperature dropped to 30°C. (E and F) Hepatocyte cell death parameters after i.p. injection with TNF (1 μg/mouse) plus GalN (20 mg/mouse). After challenge, mice were sacrificed when their body temperature dropped to 30°C. (E) Serum ALT and AST and (F) DEVDase activity in liver. (G and H) Cell death and caspase activation in CD45–CD31+PI– tumor neovascular endothelial cells. B16BL6 melanoma-bearing mice were injected s.c. paralesional with 15 μg TNF plus 5,000 IU IFN-γ or with PBS, and 24 hours later tumors were excised and (G) cell death and (H) caspase activation were measured by FACS using annexin V and Flica staining, respectively. Actual percentages of cell death in the PBS-treated animals were 63%, 26%, and 50% (G) and 55%, 55%, and 73% (H) for Tnfrsf1a+/+, Tnfrsf1a+/–, and Tnfrsf1a–/–, respectively. Data represent mean ± SEM. *P < 0.05, **P < 0.01, ***P < 0.001 (Student’s t test).

