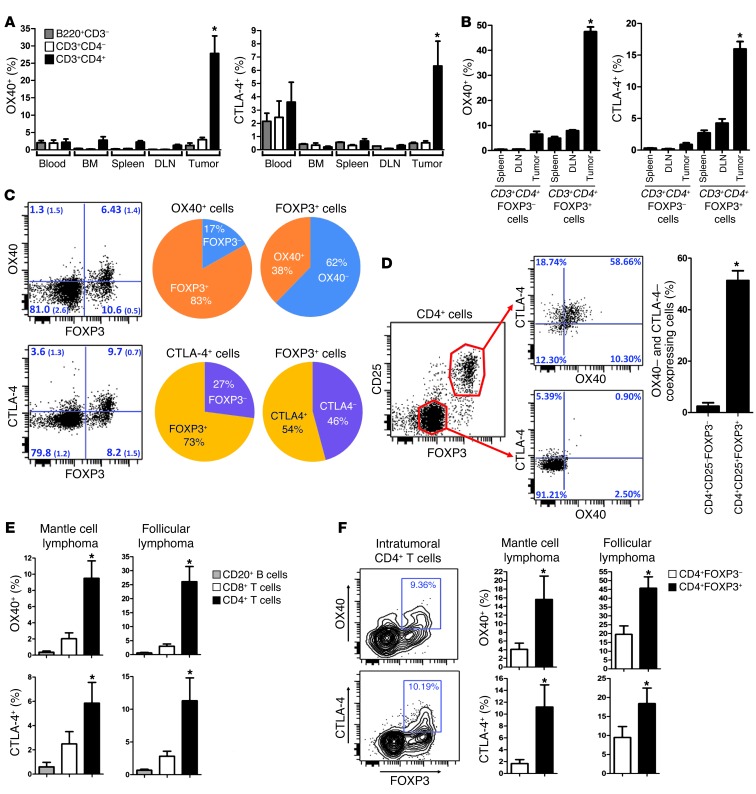
Figure 1. OX40 and CTLA-4 are highly expressed at the tumor site.
(A) Surface expression of OX40 and CTLA-4 on T and B cells (mean ± SEM) in tumor-bearing mice (n = 3) challenged with 5 × 10⁶ A20 lymphoma tumor cells s.c. On day 7, cells from blood, bone marrow, spleen, draining lymph nodes (DLN), and tumors were analyzed by flow cytometry. Proportions of OX40- and CTLA-4–positive cells within B220+CD3– (B cells), CD3+CD4–, and CD3+CD4+ (T cells) are plotted (isotype background ~0.5%). The proportion of positive cells in i.t. CD4+ T cells was significantly higher (*P < 0.05) than in any other site or cell subset, except for the expression of CTLA-4 in blood cells. (B–F) Surface expression of OX40 and CTLA-4 (mean ± SEM) (B) within FOXP3+ and FOXP3– CD3+CD4+ T cells collected from tumors, draining lymph nodes, and spleens of mice bearing tumors established for 7 days (FACS analysis, n = 5; *P < 0.001); (C) within CD3+CD4+ T cells collected from tumors (quadrant values are mean percentages (± SEM) obtained from 3 tumor-bearing mice); (D) on i.t. Tregs (n = 3, *P = 0.003); (E) within tumor-infiltrating lymphocytes of patients with mantle cell lymphoma (n = 5) and follicular lymphoma (n = 9) tumors (FACS analysis; *P < 0.05); and (F) within tumor-infiltrating CD4+ T cells of human mantle cell lymphoma (n = 5) and follicular lymphoma (n = 9) tumors (FACS analysis; *P < 0.05).

