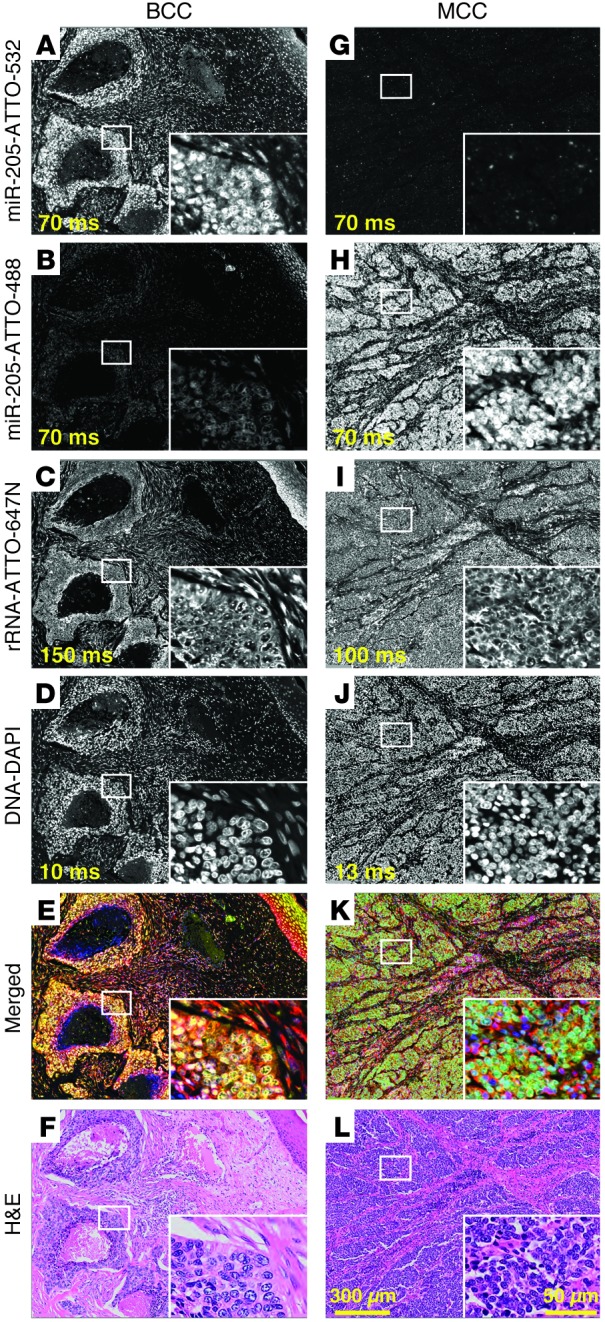
Figure 2. Multicolor miRNA FISH for BCC and MCC differential diagnosis.

Parallel detection of miR-205, miR-375, and 28S rRNA in FFPE BCC and MCC tissue sections (samples BCC1 and MCC1) by multicolor miRNA FISH. Probes (25 nM each) were cohybridized at 55°C for 16 hours in buffer containing 50% formamide and 1.0 M NaCl (probe sequences are listed in Supplemental Table 6). miR-205 was detected using a 14-nt fluorescein-hexalabeled LNA-modified probe and anti-fluorescein-HRP antibody with and tyramide/ATTO-532 signal amplification. miR-375 was detected using a 15-nt biotin-hexalabeled LNA-modified probe with HRP-conjugated streptavidin and tyramide/ATTO-488 signal amplification. miR-205 signal intensities were higher in (A) BCC than in (G) MCC, whereas miR-375 signal intensities were conversely higher in (H) MCC than in (B) BCC, consistent with our small RNA sequencing results. (C and I) 28S rRNA was detected without signal amplification by a cocktail of 4 fluorescent ATTO-647N–conjugated probes. 28S rRNA signals were similar for both BCC and MCC and used to normalize miR-205 and miR-375 signals. (D and J) Nuclei were visualized using DAPI staining. (E and K) Merged images depict BCC in yellow and MCC in green, enabling rapid tumor identification. (F and L) H&E-stained tissue sections illustrate the potential for histologic similarity between BCC and MCC. Exposure times are indicated in ms. Representative areas, indicated by white rectangles, illustrate signal localization at higher magnification in insets. Original magnification, ×20; ×60 (insets). Scale bar: 50 μm (inset); 300 μm.
