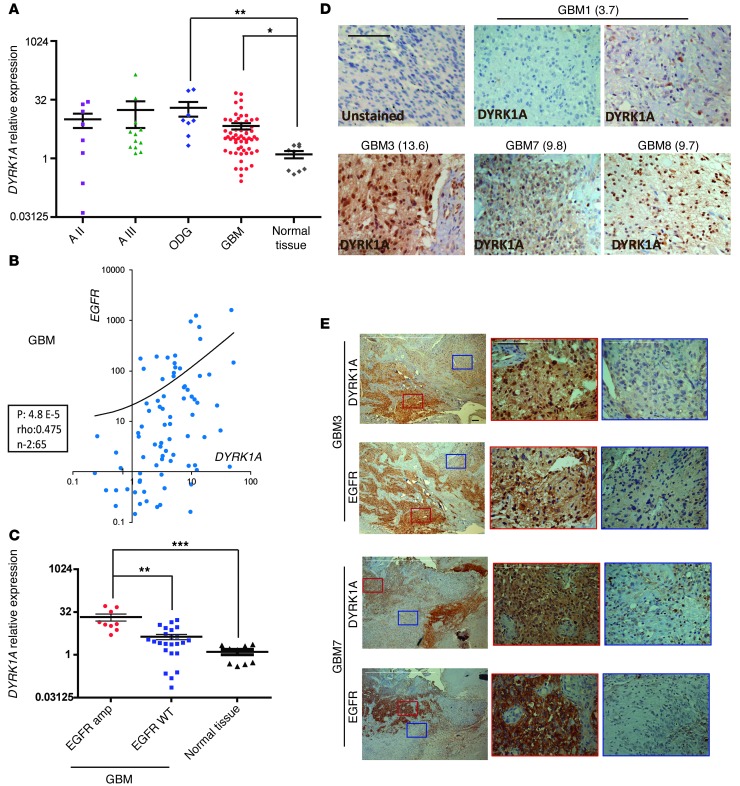
Figure 2. DYRK1A is highly expressed in a subset of gliomas and correlates with EGFR expression.
(A) DYRK1A transcript levels were determined by RT-PCR in glioma samples and normal tissue (obtained during surgery on epileptic patients). HPRT expression was used for normalization. (B) Correlation between the levels of EGFR and DYRK1A transcription in the GBM samples. Spearman’s rank correlation parameters are presented in the box. (C) Relative DYRK1A expression in EGFR-amplified (amp) and wild-type (WT) GBM samples. (D) IHC images showing an unstained control and 5 representative images of DYRK1A staining of 4 different GBMs. Relative DYRK1A RT-PCR values are shown in the brackets. (E) Low-magnification images of DYRK1A and EGFR staining of 2 different GBMs. Areas of positive (red box) and negative (blue box) staining of both markers are shown at higher magnification. A, astrocytomas. Scale bars: 50 μm. *P ≤ 0.05; **P ≤ 0.01; ***P ≤ 0.001.

