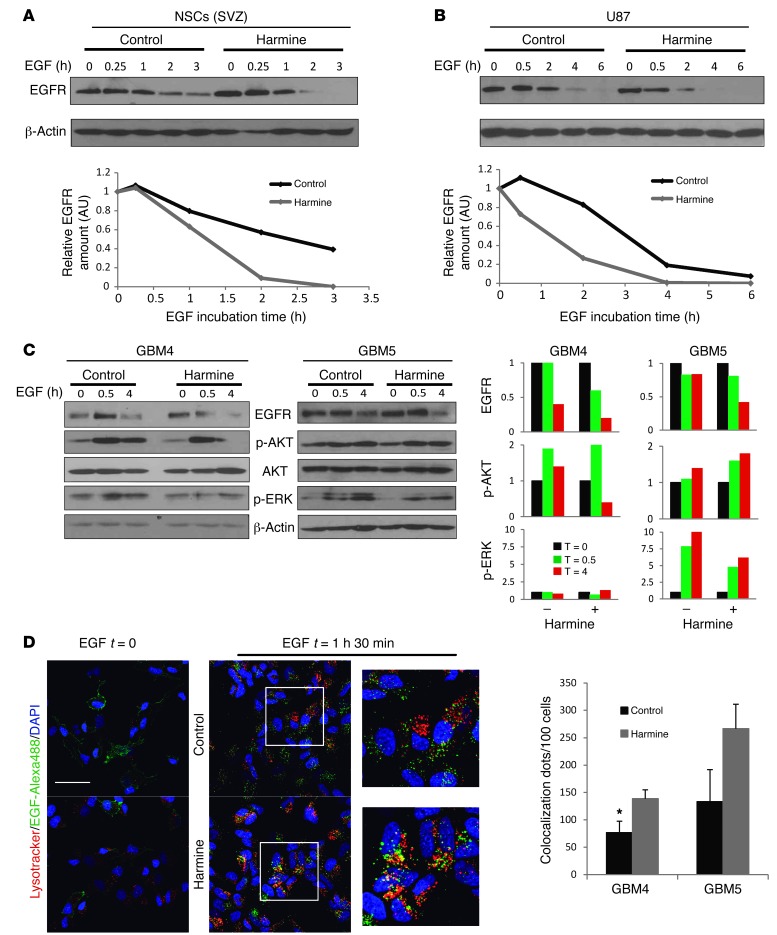
Figure 7. DYRK1A inhibition stimulates EGFR lysosomal degradation and termination of EGF signaling.
Western blot analysis of SVZ-NSCs (A) or U87 cells (B) that were deprived of growth factors for 12 hours and then exposed to EGF for the indicated durations in the presence or absence of harmine. Quantification of EGFR levels relative to β-actin is shown in the bottom graphs. (C) Western blot analysis of the EGFR signaling pathway after EGF stimulation of 2 different GBM-TIC lines in the presence or absence of harmine. Quantification of EGFR, p-AKT, and p-ERK1/2 levels relative to β-actin is shown on the right. (D) GBM-TICs were preincubated in the presence or absence of harmine. Four hours later, EGF Alexa488 was added and the cells were fixed at t = 0 or t = 1 hour, 30 minutes. Representative confocal images of EGFR lysosomal targeting in GBM4 cells are shown. Quantification of the yellow dots for 2 different GBM-TIC lines is represented by the graph on the right. *P ≤ 0.05. Scale bar: 25 μm.

