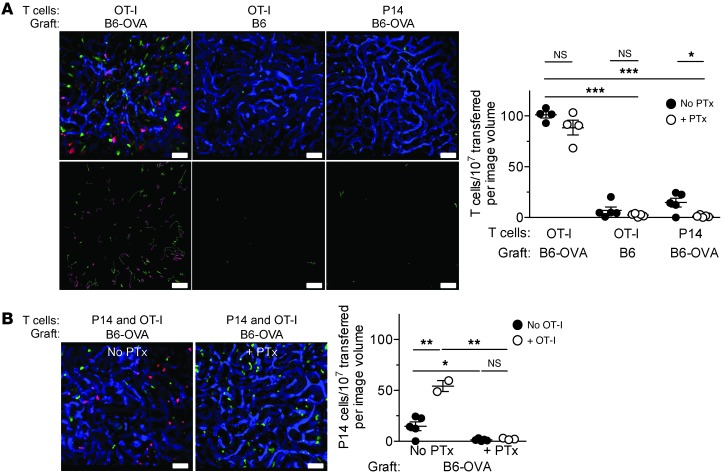
Figure 3. Imaging of effector T cells in kidney grafts by 2-photon intravital microscopy.
OT-I and P14 effector T cells were transferred to kidney graft recipients 2 days after transplantation. Grafts were imaged 24 hours after cell transfer. z stacks (0.45 × 0.45 × 0.03 mm) were obtained at 30-second intervals. (A) Visualization and enumeration of PTx-treated and untreated OT-I and P14 cells arrested in B6-OVA or B6 kidney grafts (n = 4–5 videos/group, 2 independent experiments). Volume-rendered representative time point images (top) show arrested PTx-treated (red) and untreated (green) cells in each of the experimental groups; blood vessels are labeled in blue. 30-minute time projections (bottom) depict PTx-treated (red) and untreated (green) cell tracks. (B) Volume-rendered representative time point images of B6-OVA grafts after cotransfer of P14 (red) and OT-I (green) cells treated or not with PTx; blood vessels are labeled in blue. Enumeration of P14 cells arrested in B6-OVA kidney grafts in the presence or absence of OT-I cells and PTx is also shown (n = 2–5 videos/group, 2 independent experiments). Results are mean ± SEM. *P < 0.05; **P < 0.01; ***P < 0.001. Scale bars: 50 μm.

