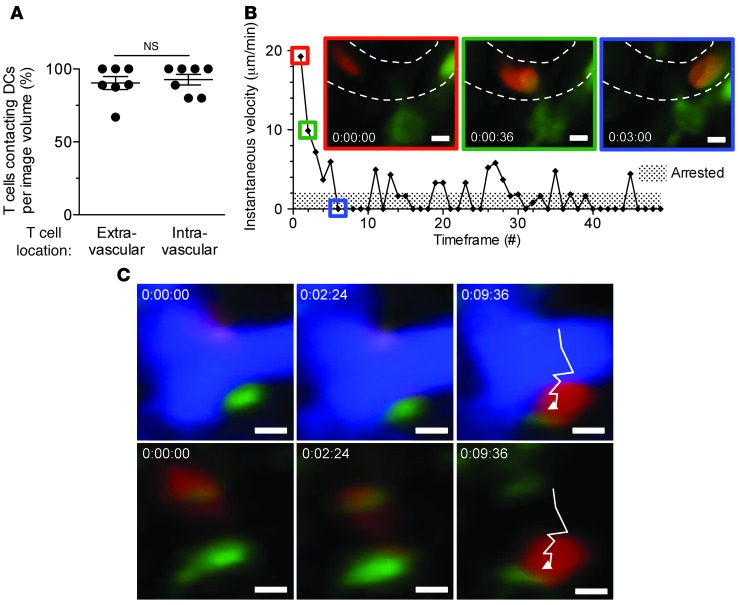
Figure 6. Effector T cell interaction with bone marrow–derived APCs during firm adhesion and transmigration.
OT-I effectors were imaged as described in Figure 3. Results shown are analysis of first experimental group in Figure 5A. (A) Percent OT-I cells making stable contacts with YFP+ DCs in B6-OVA kidney grafts in which H-2KB expression was restricted to bone marrow–derived APCs (n = 7 videos, 3 independent experiments). (B) Visualization and instantaneous velocity of an OT-I cell (red) arrested in a blood vessel (dashed outline) after making stable contact with a YFP+ DC (green). (C) Time-lapse images showing an OT-I cell (red) making stable contact with a YFP+ DC (green) throughout the transmigration process. Blood vessel (blue) is subtracted below. Results are mean ± SEM. Scale bars: 5 μm.

