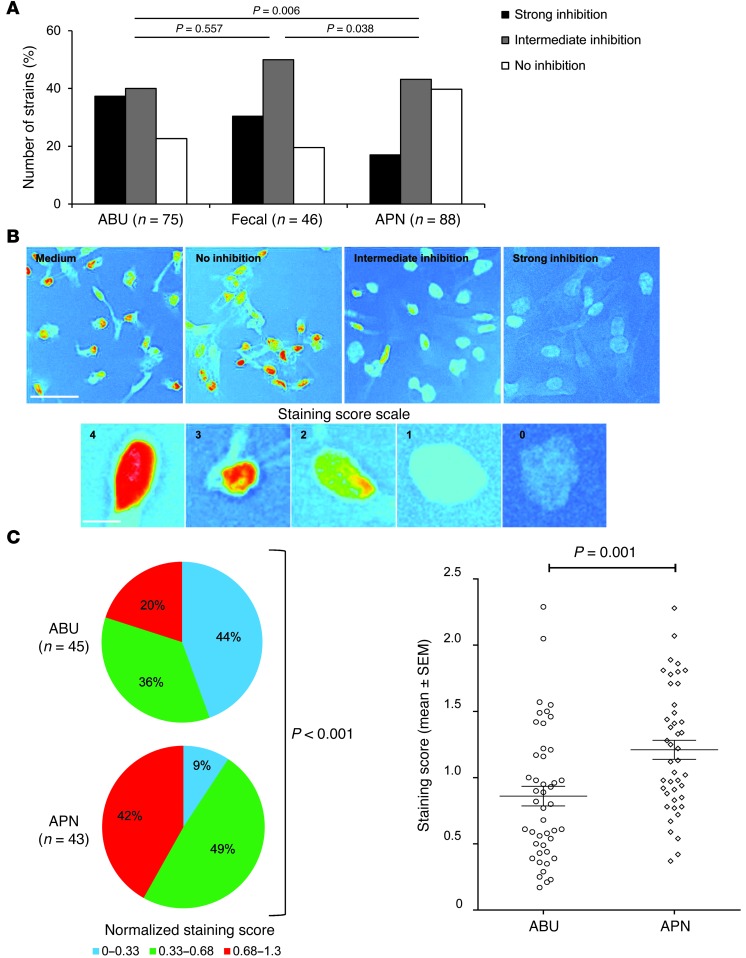
Figure 7. Epidemiologic analysis of Pol II suppression.
(A) Higher frequency of Pol II suppression in A498 cells infected with ABU or fecal strains than with APN strains. (B) Light microscopic images of Pol II phosphorylation at Ser2 in A498 cells, analyzed by ImageJ, using changed lookup tables and inverted colors. Scale bar: 50 μm (upper panel). Each strain was assigned a staining score based on the scale and is illustrated in the lower panel (scale bar: 10 μm). (C) Strongly inhibitory strains were more abundant in the ABU (44%) than in the APN group (9%, P < 0.001), and the staining score was lower (P = 0.001).

