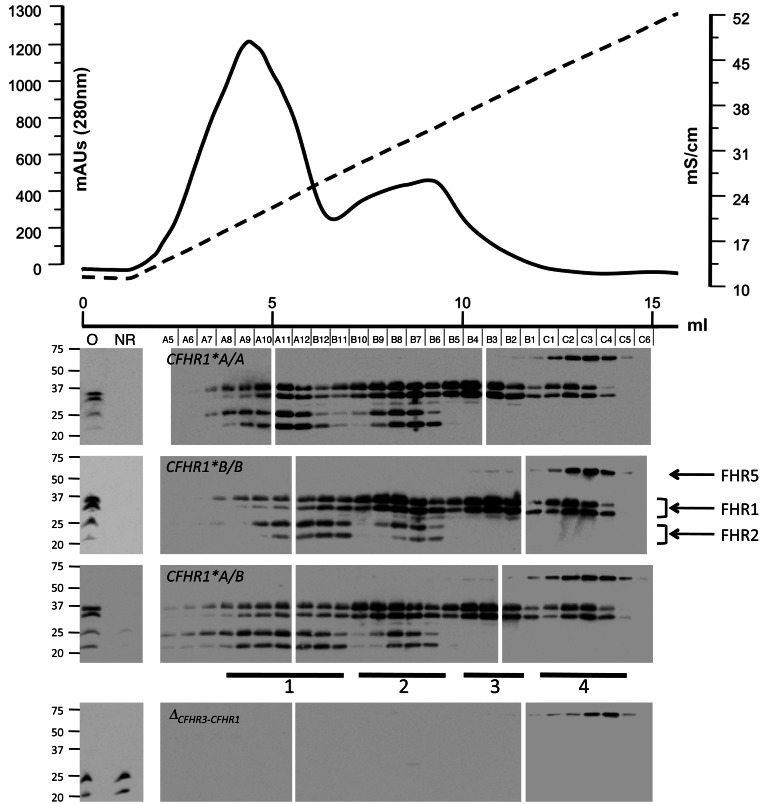
Figure 3. Heparin chromatography of FHR1, FHR2, and FHR5 proteins.
Elution profiles of FHR1, FHR2, and FHR5 from individuals of the 3 CFHR1*A/B genotypes illustrated that FHR1 eluted in 4 distinct peaks at different NaCl concentrations. Top: Representative case of how plasma proteins retained in the heparin column were eluted with the NaCl gradient. Bottom: Western blots used the MBC125 mAb to determine the elution position of the different FHRs. Peaks 1–4 are indicated. FHR1 coeluted with FHR2 in the first 2 peaks: in peak 1, FHR1 and FHR2 showed equimolar quantities (FHR1-FHR2); in peak 2, FHR1 was approximately 3 times more abundant than FHR2 (FHR13-FHR2). In peak 3, FHR1 eluted alone, and in peak 4, FHR1 and FHR5 coeluted at approximately equimolar quantities (FHR1-FHR5). FHRs were identified simultaneously by Western blot using MBC125 mAb, which recognizes an epitope common to the 3 FHRs. Protein bands corresponding to FHR1, FHR2, and FHR5 are indicated at right. Also shown is Western blot of the elution profile corresponding to an individual homozygote for the ΔCFHR3-CFHR1 allele, illustrating that FHR2 was not retained in the column in the absence of FHR1. Samples from the elution profiles were run in 3 separate gels. O, original; NR, nonretained.

