Figure 1.

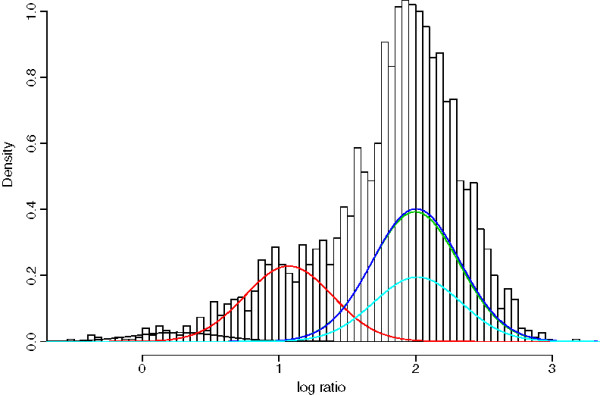
Simulation: Gaussian mixture models. Gaussian Mixture Model fit for one of the simulated CNV regions with MAF=0.1 and SNR=3. The Gaussian mixture components are shown in different colors and overlaid the histogram.

Simulation: Gaussian mixture models. Gaussian Mixture Model fit for one of the simulated CNV regions with MAF=0.1 and SNR=3. The Gaussian mixture components are shown in different colors and overlaid the histogram.