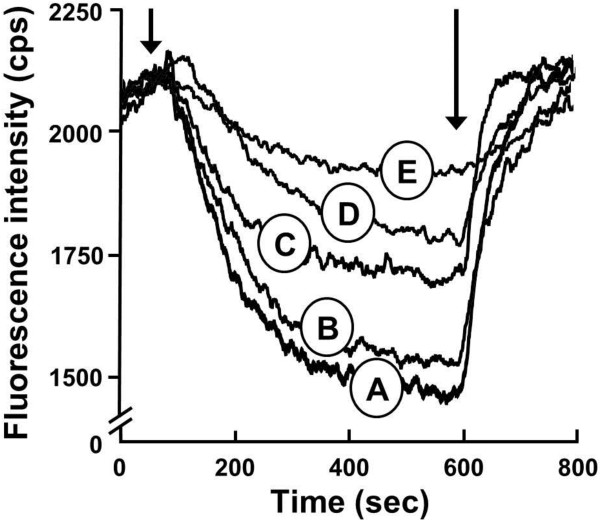
Figure 5.
Whole cell ethidium bromide transport assays performed in the presence of different concentrations of NaCl. Representative traces of the efflux of EtBr from cells expressing wild-type MdtM in the presence of 0 mM (A), 20 mM (B), 50 mM (C) and 100 mM (D) NaCl. EtBr efflux was monitored continuously by measuring fluorescence emission at 600 nm upon excitation at 545 nm. UTL2 cells that expressed the MdtM D22A mutant in the absence of added NaCl were used as a control (E). Cells loaded with EtBr were energised by addition of glucose (as indicated by the first arrow) and efflux of EtBr was monitored for 800 s. CCCP (100 μM) was added (as indicated by the second arrow) to abolish active transport. Fluorescence intensity was measured in counts per second (cps).

