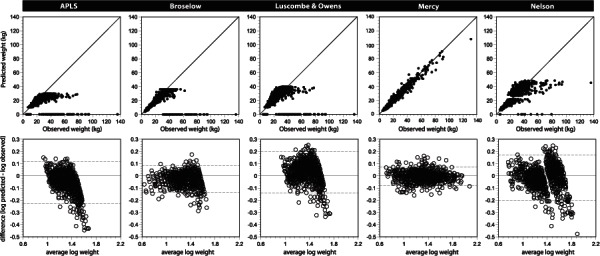
Figure 1.

Observed Versus Predicted Weights for Weight Estimation Methods Evaluated in this Study
(Upper panels) Values that fall on the x-axis indicate individuals for whom no weight could be calculated because length and/or age exceeded the bounds of the estimation method. (Lower panels) Bland-Altman plots depicting the log-transformed difference between predicted weight and observed weight versus average log weight for the children in this external validation data set. Dashed lines depict the 95% limits of agreement.
