Figure 6.
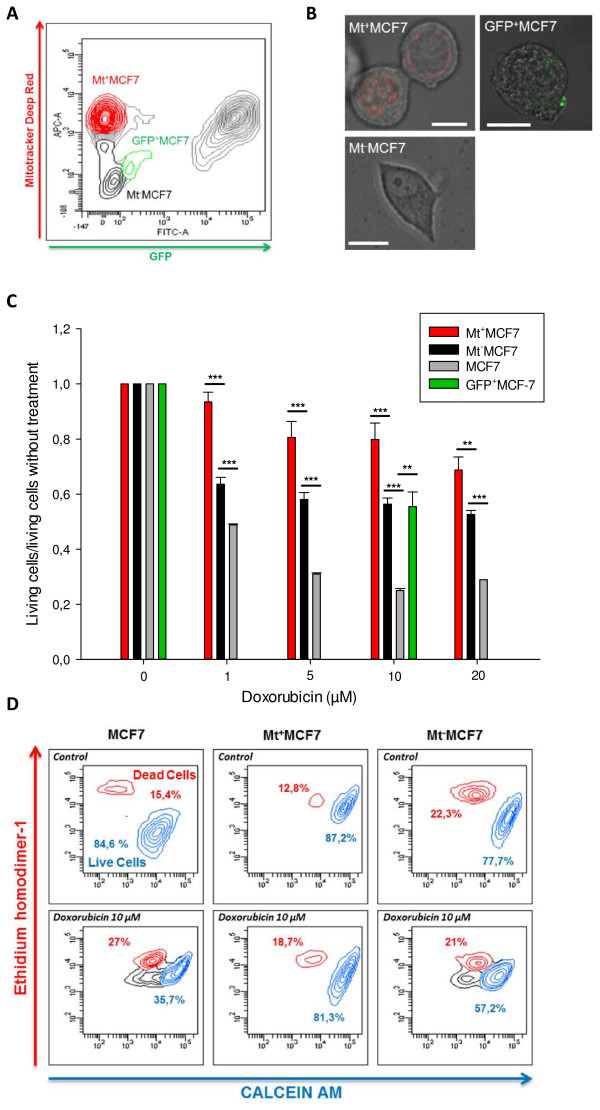
Transfer of mitochondria from eGFP-E4+ECs to MCF7 confers chemoresistance. A, Flow Cytometry Scatter plot showing the gating strategy for definition of the different cell-populations subjected to cell sorting. B, Confocal imaging post-sorting. Mt+MCF7 displayed Mitotracker staining (top left panel) and GFP+MCF7, GFP staining (top right panel) however Mt-MCF7 did not display Mitotracker nor GFP staining (bottom panel). Scale bar: 10 μm.C, MTT assay after doxorubicine treatment was performed on sorted cells. Mt+MCF7 population (red) displayed significantly increased chemoresistance compared to other control populations. However compared to controls, Mt-MCF7 (black) or GFP+MCF7 (green) displayed also chemoresistance (10 μM doxorubicine). (p < 0.05 (*), p < 0.01 (**) or p < 0.001 (***)). D, Cell viability was assessed for Mt+MCF7, Mt-MCF7 and control MCF7 treated by 10 μM doxorubicine using Live/Dead Invitrogen kit (calcein AM and ethidium homodimer-1). Mt+MCF7 displayed chemoresistance. Experiments were performed in triplicate.

