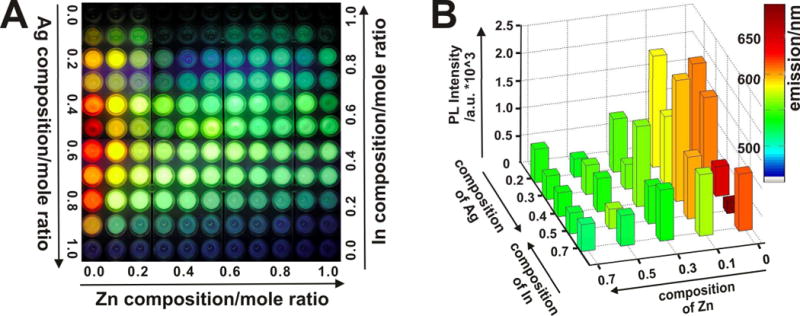
Figure 2. Photoluminescent properties of the ZAIS QD library.

(A) Representative fluorescent image of the entire library of ZAIS QDs with varying compositions (ZnxS − AgyIn1−yS2)synthesized via the sonochemical approach. (B) Heat map depicting the PL intensity (z axis) vs. Zn and Ag/In concentrations (x and y axis) for select compositions of the ZAIS nanoparticles library. Column color indicates the maximum emission wavelength.
