
Figure 3. Physical characterization of the ZnxS − AgyIn(1−y)S2QDs.
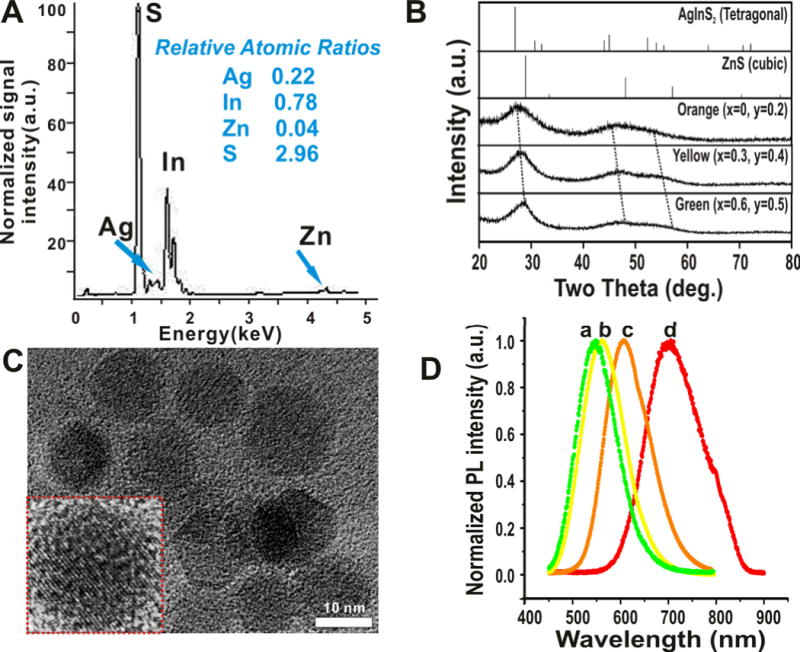
(A) X-ray Fluorescence analysis of one of the ZAIS QD (x = 0, y = 0.2) showing the elemental composition and relative atomic mole ratios of the constituent elements. The composition agrees to that calculated theoretically. (B) X-ray diffraction patterns of the ZAIS QDs prepared using sonochemistry. The values of x and y are indicated in the figure. Reference patterns of bulk ZnS and AgInS2 are also shown. Broad peak width is attributed to the amorphous nature of the ZAIS QDs. (C) TEM images of one of the ZAIS QDs (x = 0, y = 0.2) clearly shows the monodispersity and narrow size distribution (n = 100). Inset shows the high resolution image of a single nanoparticle (Scale bar = 10 nm). (D) Photoluminescence spectra of select water-soluble ZAIS QDs (a: x = 0.6, y = 0.5.; b: x = 0.3, y = 0.4; c: x = 0, y = 0.2; d: x = 0, y = 0.5)