
Figure 4. Biocompatibility and cellular imaging studies of ZAIS-QDs in mammalian cells.
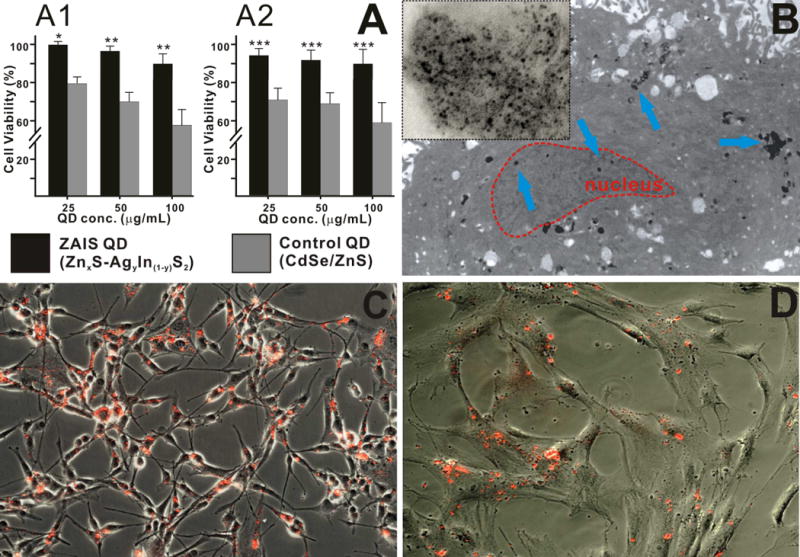
(A) Comparison of the cellular cytotoxicity of the water soluble ZAIS QD (Zn0S − Ag0.2In0.8S2) and CdSe/ZnS QDs at different concentrations in U87 cells (A1) and hMSCs (A2). The results are presented as means ± SD from three independent experiments. Student’s unpaired t-test was used for evaluating the statistical significance of the cytotoxicity of ZAIS QDs (* = P < 0.001, ** = P < 0.01, *** = P < 0.05) as compared to the CdSe/ZnS QDs (B) Transmission electron microscopy of the ZAIS QD in hMSCs. The image clearly shows the presence of the QDs (marked by blue arrows) in the cytoplasm and the nucleus (marked in red). The inset depicting the magnified image of the QD cluster, confirms the monodisperse nature of the QDs inside the cell. (C) and (D) Fluorescence microscopy imaging demonstrating the uptake of the water soluble ZAIS-QD (λem = 606 nm) in U87 cells (C) and hMSCs (D).