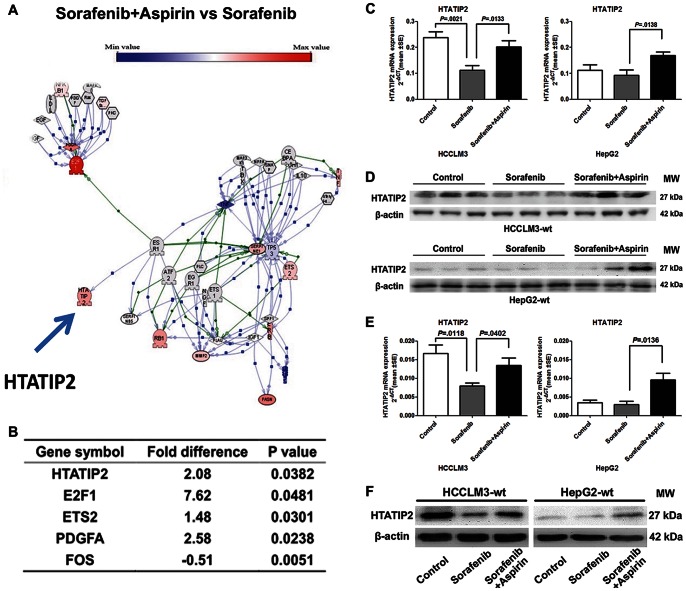
Figure 2. Aspirin up-regulated HTATIP2, which was down-regulated by sorafenib.
(A) Gene network analysis by Ariadne software shows differences in 84 genes between the sorafenib and aspirin combination group and the sorafenib group. (B) Comparison of gene expression in the sorafenib and aspirin combination group and the sorafenib group. (C, D) Expression of HTATIP2 in HCCLM3-wt and HepG2-wt tumors was evaluated at the mRNA level (C) and protein level (D). (E, F) Expression of HTATIP2 in HCCLM3-wt and HepG2-wt cell lines was confirmed at the mRNA level (E) and protein level (F). (Columns, mean of 6 samples in each group; bars, SEM).

