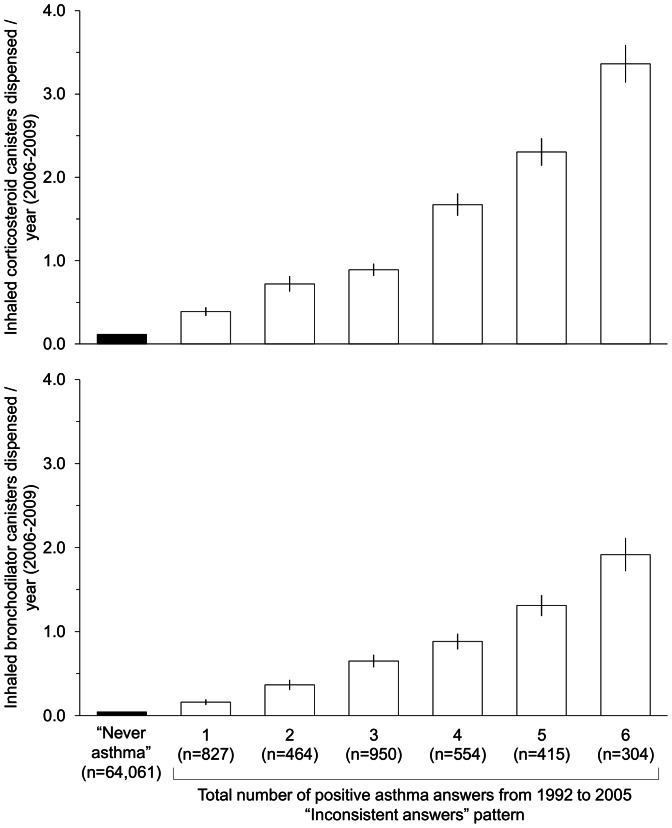
Figure 3. Asthma drugs dispensed and total number of positive asthma answers in the “Inconsistent answers” pattern.
The figures represent the means +/− standard error of canisters dispensed during the 4-year period 2006–2009. The “Never asthma” pattern was taken as the descriptive reference. All p for trend were <0.001.

