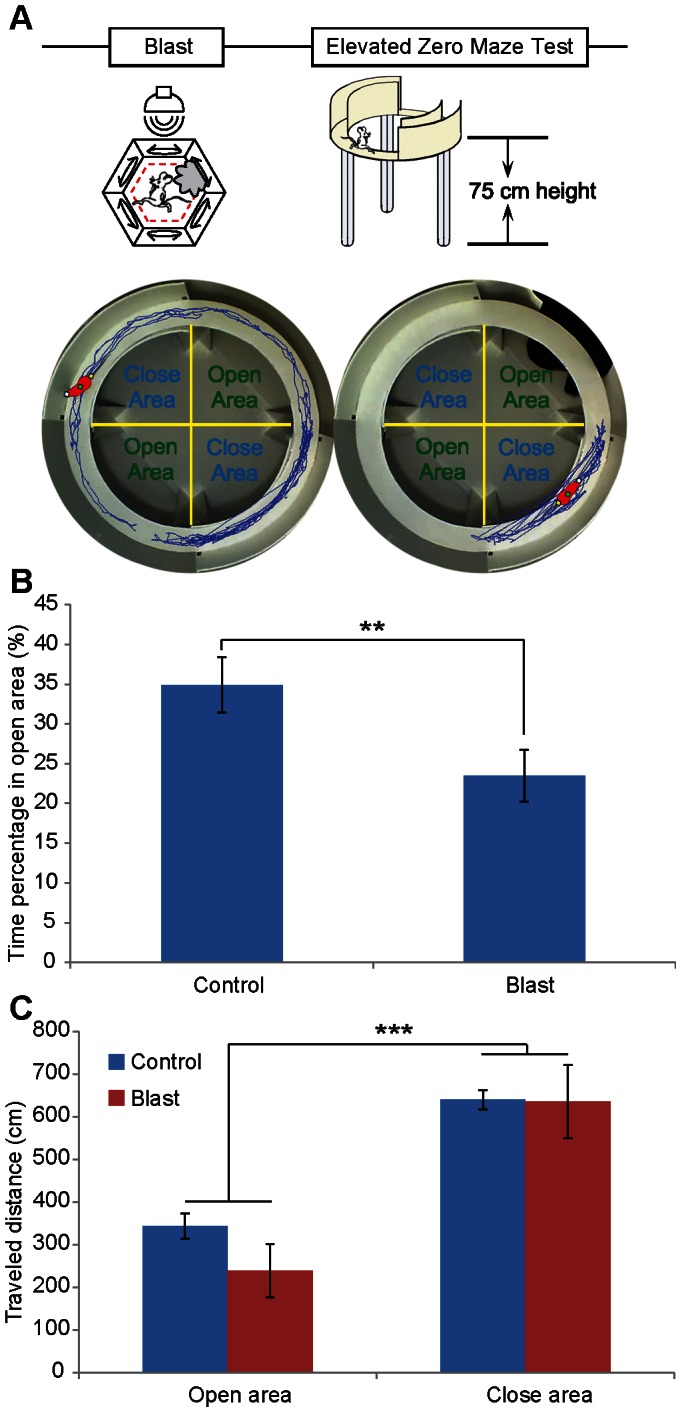
Figure 5. Effects of mild blast on the elevated O-maze.

(A) Schematic illustration of mild blast and the elevated O-maze test is shown on the top. A single 1-min mild blast was introduced to the mice five minutes prior to the elevated O-maze test. Representative trajectories of a control and blasted mouse on the elevated O-maze are shown in the middle panels. A total of 5 min was used for the measurement. (B) Reduced time spent in the open area after mild blast. (n = 10 mice each group, student t-test, **p<0.01.) (C) Control and blast mice exhibited the difference between open and close area in traveled distance, but no difference was observed between blast and control mice (student t-test, ***p<0.001).
