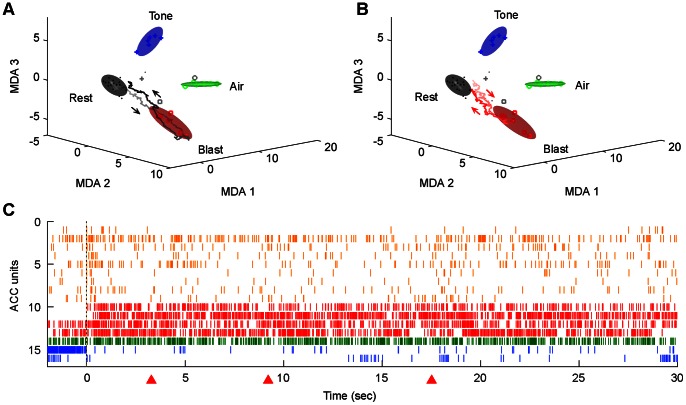
Figure 10. Classification and dynamic decoding of ACC real-time ensemble representations of blast events.
(A) Firing patterns during rest (dots, black ellipsoid), blast (squares, red ellipsoid), tone (plus, blue ellipsoid), and air-blast (circle, green ellipsoid) epochs are shown after being projected to a three-dimensional space obtained by using MDA. MDA1–3 denote the discriminant axes. Both training and test (grey symbols) data are shown. The trajectories in this three-dimensional space indicate dynamical monitoring of ensemble activity from 1sec before to 2 sec after the actual startling events respectively. The black arrows indicate the direction of the trajectories. Note the trajectories start in the rest cluster 1 sec before the startling events occurred, and move toward the respective event cluster, then returned to the rest. (B) The post-blast reverberation trajectories are shown in red, and directionality indicated by arrows. (C) 30 sec of post-blast ensemble pattern of simultaneously recorded ACC units is shown. Units are grouped by the different types of responses to mild blast stimuli (transient on in orange, transient off in green, prolonged on in red and off-type in blue). Time zero indicates the time point when the stimuli were presented. Red triangles below the x-axis indicate the time point at which the post-blast reverberations took place.

