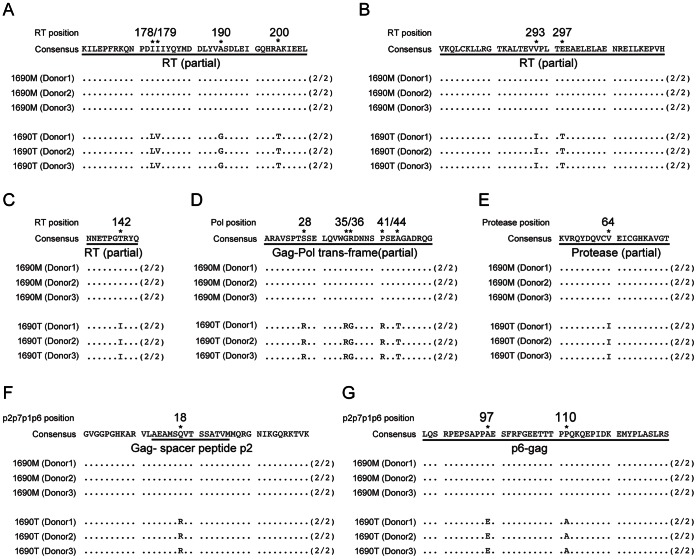
Figure 4. Deduced amino acid sequence alignment of HIV-1 Gag-Pol regions of MDM-selected 1690 M and 1690 T.
Amino acid sequence differences between MDM selected 1690 M and 1690 T were shown in the regions of reverse transcriptase (A-C), Gag-Pol trans-frame (D), protease (E), Gag p2 (F) and Gag p6 (G). MDM from 3 different donors (Donor 1, 2 and 3) were infected with 1690 M and 1690 T, respectively. Supernatants were harvested on Day 22 post-infection and subjected to RT-PCR and sequence analysis on Gag-Pol regions of HIV-1. (2/2) represents the same individual sequences were detected from two RT-PCR. Differential residuals were indicated by both “*” and position numbers aligned with HXB2 sequences.

