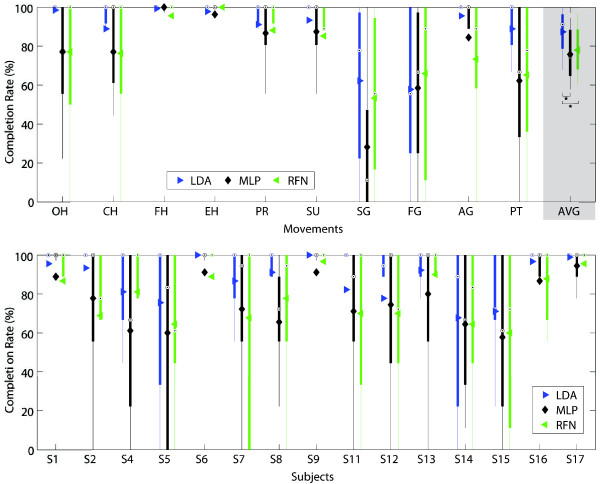
Figure 11.
Completion rate. The completion rate between classifiers per movement (top) and subjects (bottom) are presented in box plots where the central mark represents the median value; the edges of the box are the 25th and 75th percentiles; the whiskers give the range of data values without considering outliers for clarity; and solid markers represent the mean. The completion rate is equal to the number of movements that achieved completion time over all the attempted movements. The average completion rates for LDA, MLP and RFN were 87.3(±11)%, 75.8(±13)%, and 78.0(±12)%, respectively. Statistical significance (p<0.05) is shown only for the average values by “ * ”.

