
Figure 12.
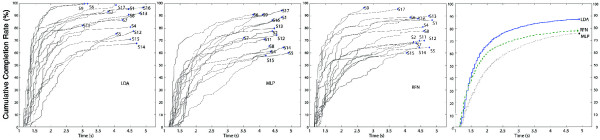
Cumulative completion rate. The cumulative completion rate illustrates the percentage of completed motions within a time span. E.g. The rightmost insert shows that over 80% of motions were completed within 3 seconds using LDA. Inserts from left to right show the cumulative completion rate of each trial per subject for LDA, MLP and RFN. The rightmost insert considers all trails of all subjects for each algorithm.