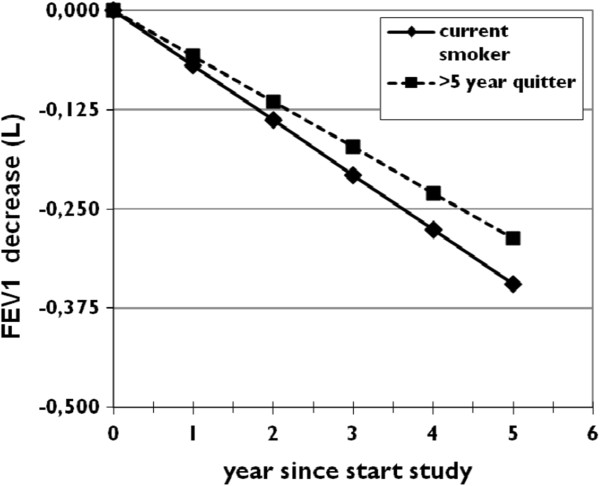
Figure 3.
Graph showing the decrease of FEV1 in two men, age 60 at the start of the observation (t=0) with 40 packyears smoked in GOLD stage 1 (height 175 cm). One is a current smoker, the other a >5 year quitter. For sake of clarity the other two smoking groups were omitted from this graph as their FEV1 decrease.

