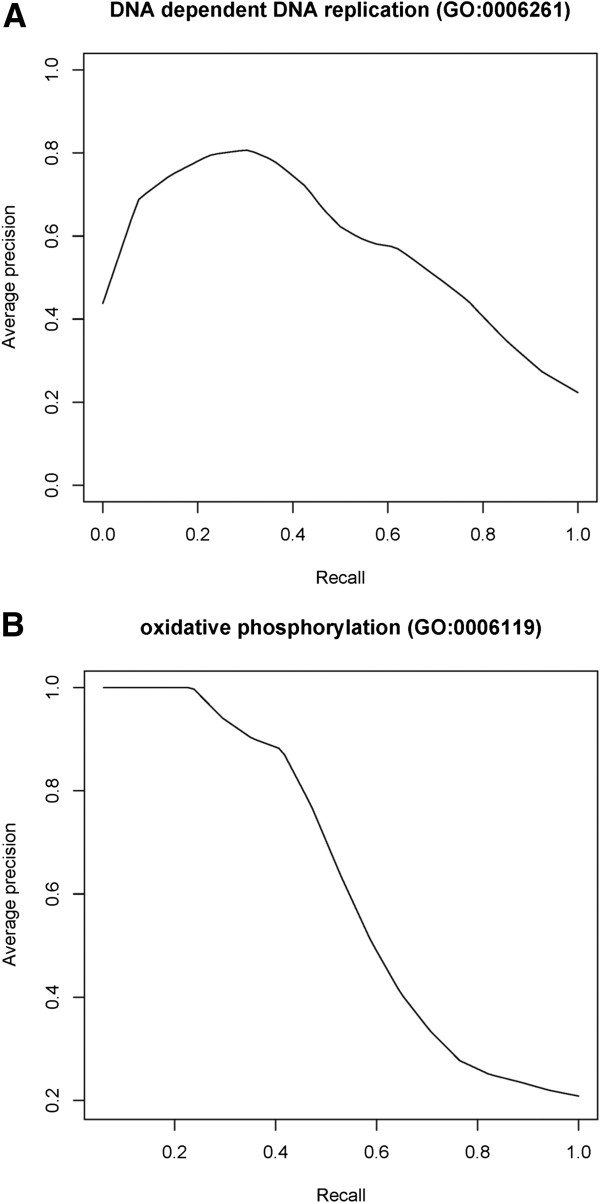
Figure 2.

Precision‐recall Plots for Two of the GO‐ Biological Process Categories. Plots show the fold‐average precision that corresponds to a recall value for (A) DNA‐dependent DNA replication, and (B) oxidative phosphorylation GO categories. Vertical averaging method was used.
