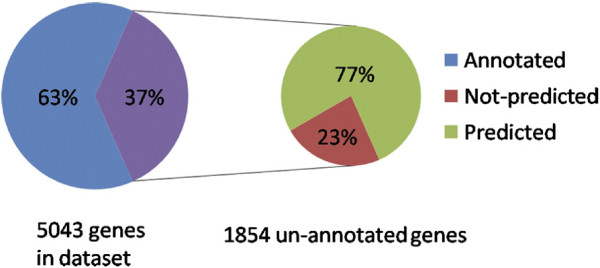
Figure 4.

The Proportion of genes that are Annotated, Un‐annotated, and Predicted by the SVM to Belong to a GO‐BP Category. Genes from the developmental time course data set that had no GO‐BP annotation were broken down into genes that were predicted with high confidence to belong to a GO‐BP category (predicted), and those that had low prediction values (not predicted).
