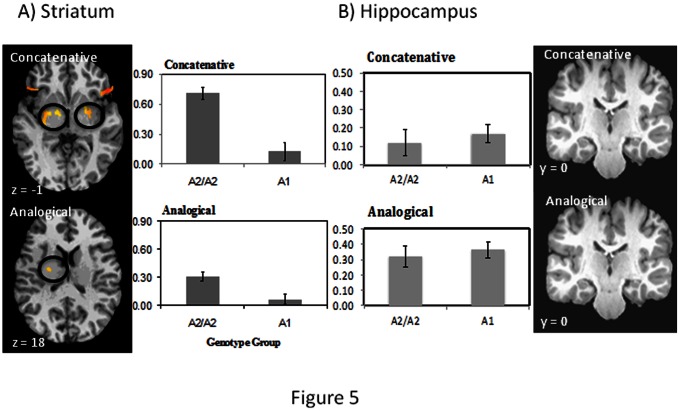
Figure 5. (A) Brain activation differences in the striatum between the A2/A2 and the A1 group in the concatenative grammar and analogical grammar learning conditions.
Circled regions on the left panels highlight activation differences in the striatum (warmer color shows higher t-values, see Table 1); note that activation in the inferior frontal region can also be seen on the concatenative slide. Right half of (A) show averaged activities (% signal change) in the striatum bilaterally for each condition in each group. (B) Brain activation differences in the hippocampus between the A2/A2 and the A1 group in the concatenative grammar and analogical grammar learning conditions. No regions show any significant differences. Left half of (B) shows averaged activities (% signal change) in the hippocampus bilaterally for each condition.

