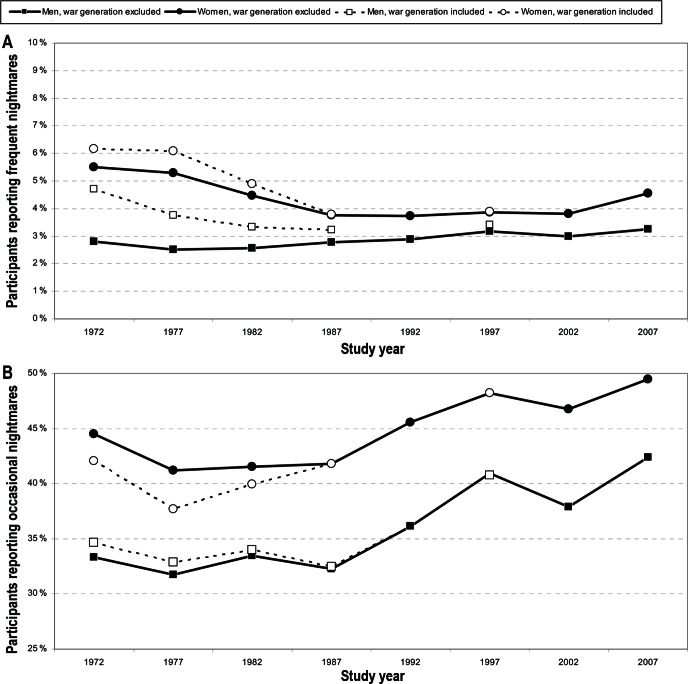
Figure 2.
(A) Prevalence of frequent nightmares in the different study years. Solid lines represent the general population (war generation excluded) (n = 58,598) whereas dotted lines represent the whole sample (n = 69,813). (B) Prevalence of occasional nightmares in the different study years. Solid lines represent the general population (war generation excluded) (n = 58,598) and dotted lines represent the whole sample (n = 69,813).Note that the y-axis starts at 25% to make the graph more readable.

