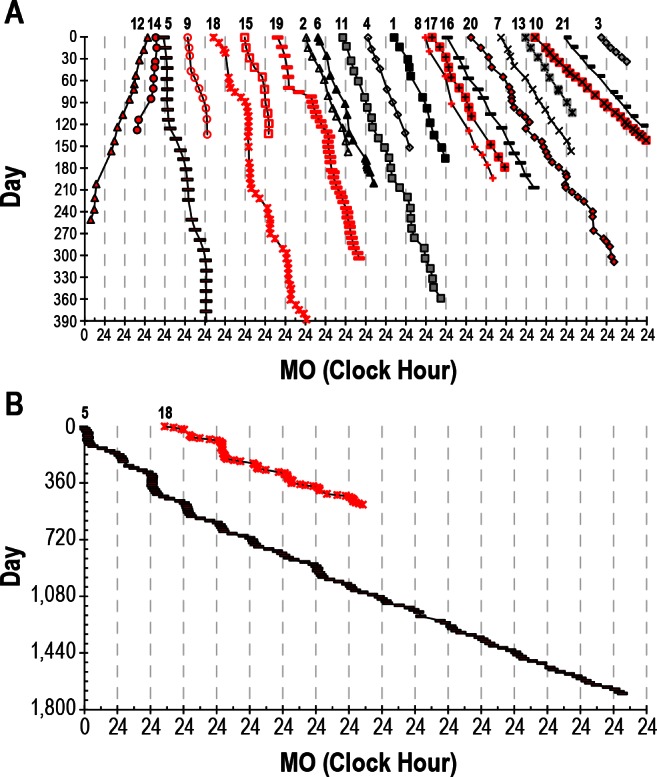
Figure 1.

(A) Twenty-one nonentrained blind individuals. Symbols represent an assessment of circadian phase (melatonin onset, MO) assessed using the time that plasma or salivary melatonin levels cross a threshold of 10 or 3 pg/mL, respectively. Women are plotted in red and men in black and gray. Subject numbers are displayed across the top of the figure. Not all data are plotted for Subjects 5 and 18. The data are plotted in a raster format where the day of study is plotted on the y-axis with successive days plotted beneath each other and the clock hour of the MOs are plotted on a repeating 24-h x-axis. The data for each subject are plotted next to each other with overall drift rate generally increasing from left to right so that all of the data can be visualized in one figure. (B) The complete dataset for Subjects 5 and 18.
