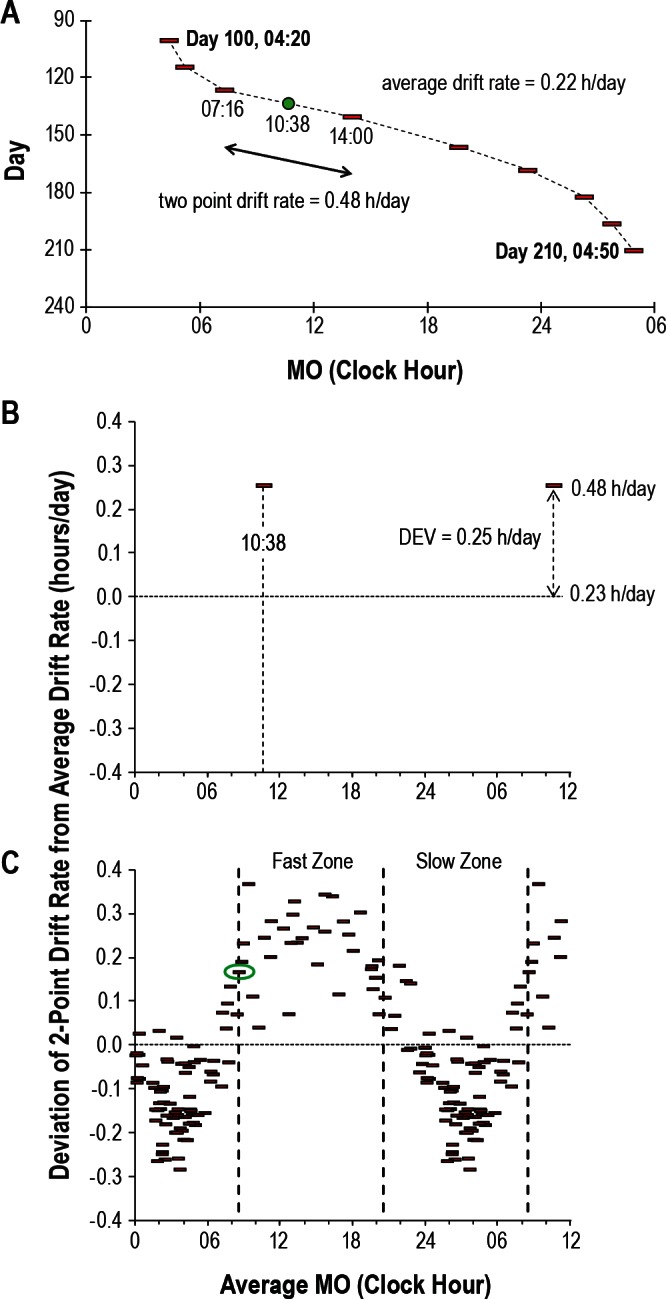
Figure 2.

Illustration of the bisection technique for quantification of relative coordination. Data are presented for Subject 5. (A) Representative section of data from study days 100 to 210 with symbols and format as in Figure 1. The average drift rate for this portion of the dataset is 0.22 h/per day (24.5 h over 110 days). This is similar to the 0.23 h/day for all 1,547 days of study). The two-point drift rate between the melatonin onset (MO) occurring at 07:16 and the MO occurring at 14:00 is 0.48 h/day. The average MO (MOavg) between these two is 10:38 (green circle). (B) The average MO from Figure 2A (10:38) is plotted against the corresponding deviation (DEV, in hours) of the two-point drift rate (0.48 h/day) from the average drift rate (0.23 h/day). The data are plotted 1.5 times. (C) The clock hour of each MOavg is plotted against all corresponding DEVs. The data are again plotted 1.5 times. The data point circled in green is the MOavg that resulted in the largest difference in average DEV between two corresponding 12-h zones. The vertical dashed lines denote the boundaries of the zones with fast and slow drift rates.
